Greenland and Antarctic ice-sheet maps
Interactive maps and A0 posters of the Greenland and Antarctic ice sheets: surface ice velocity over hillshaded topography, with drainage regions, surface contours, the median sea-ice edge, key numbers and place names. They are made with Julia and CairoMakie; the code is on GitHub, and Data & methods lists the sources and how the maps are made.
Interactive maps
Greenland →
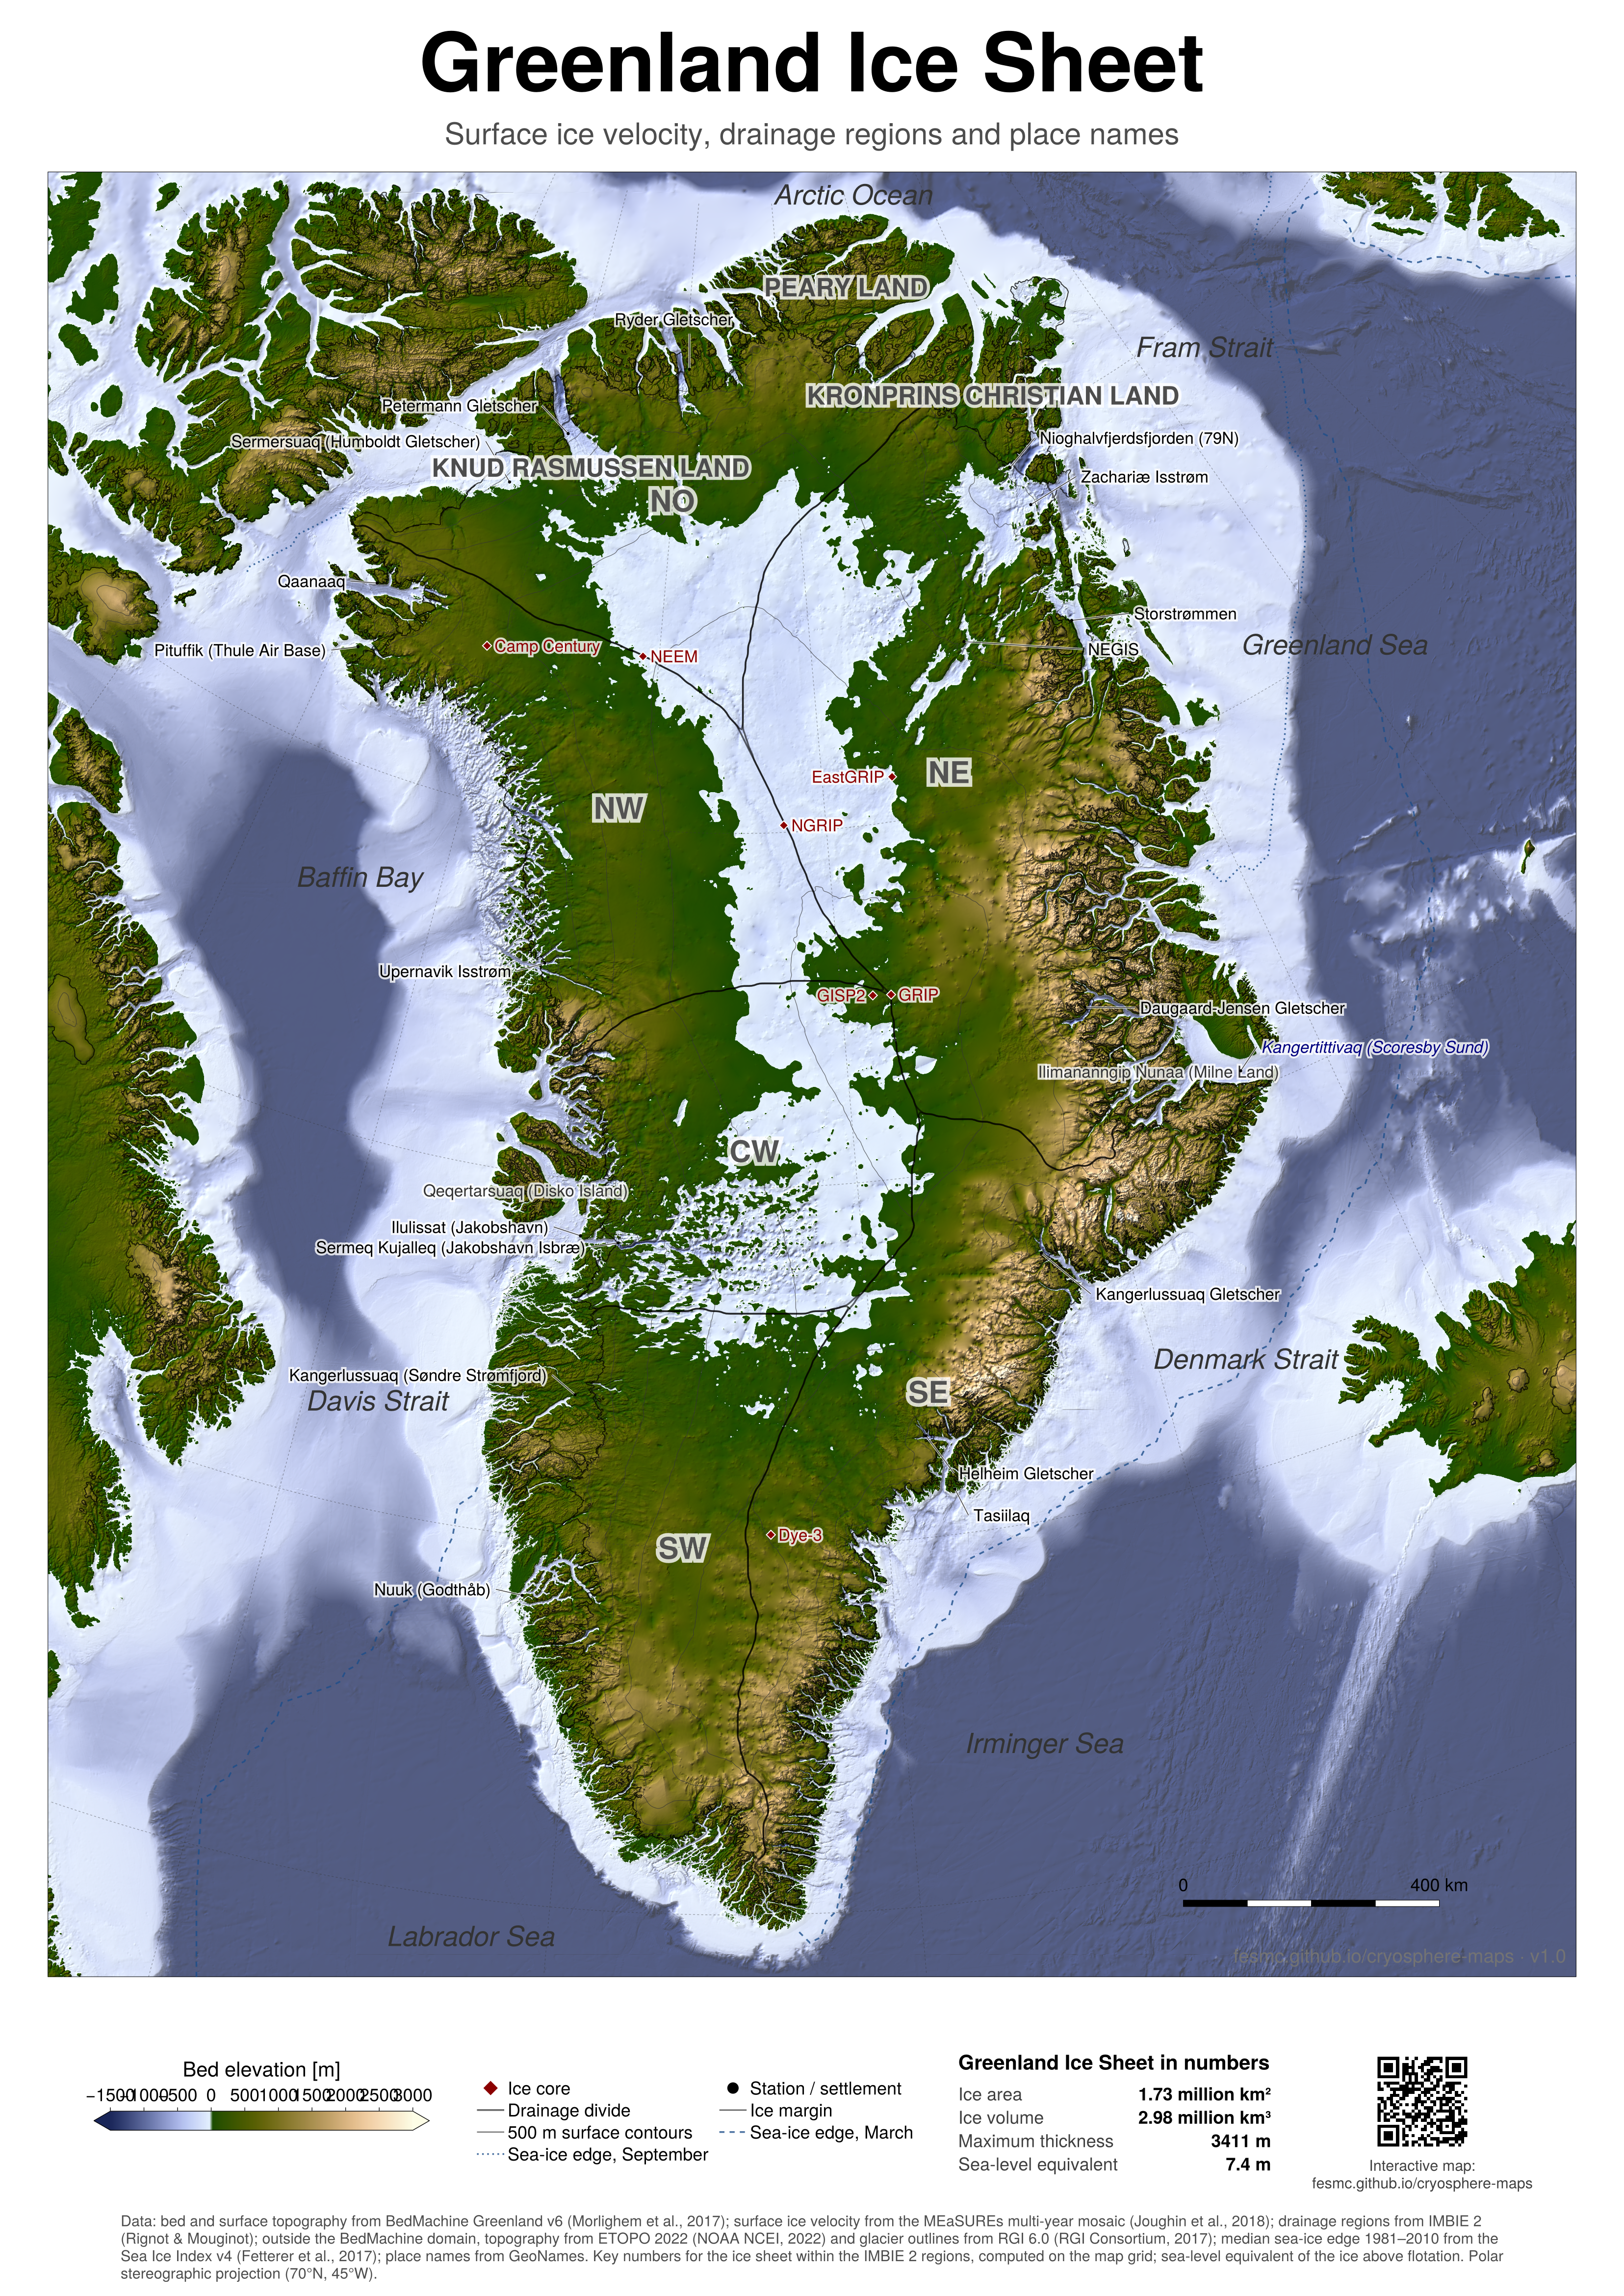
Ice velocity, surface and bed elevation at 500 m, with drainage regions, contours, sea-ice edges and all glacier names (GeoNames). Search for a name to find it.
Antarctica →
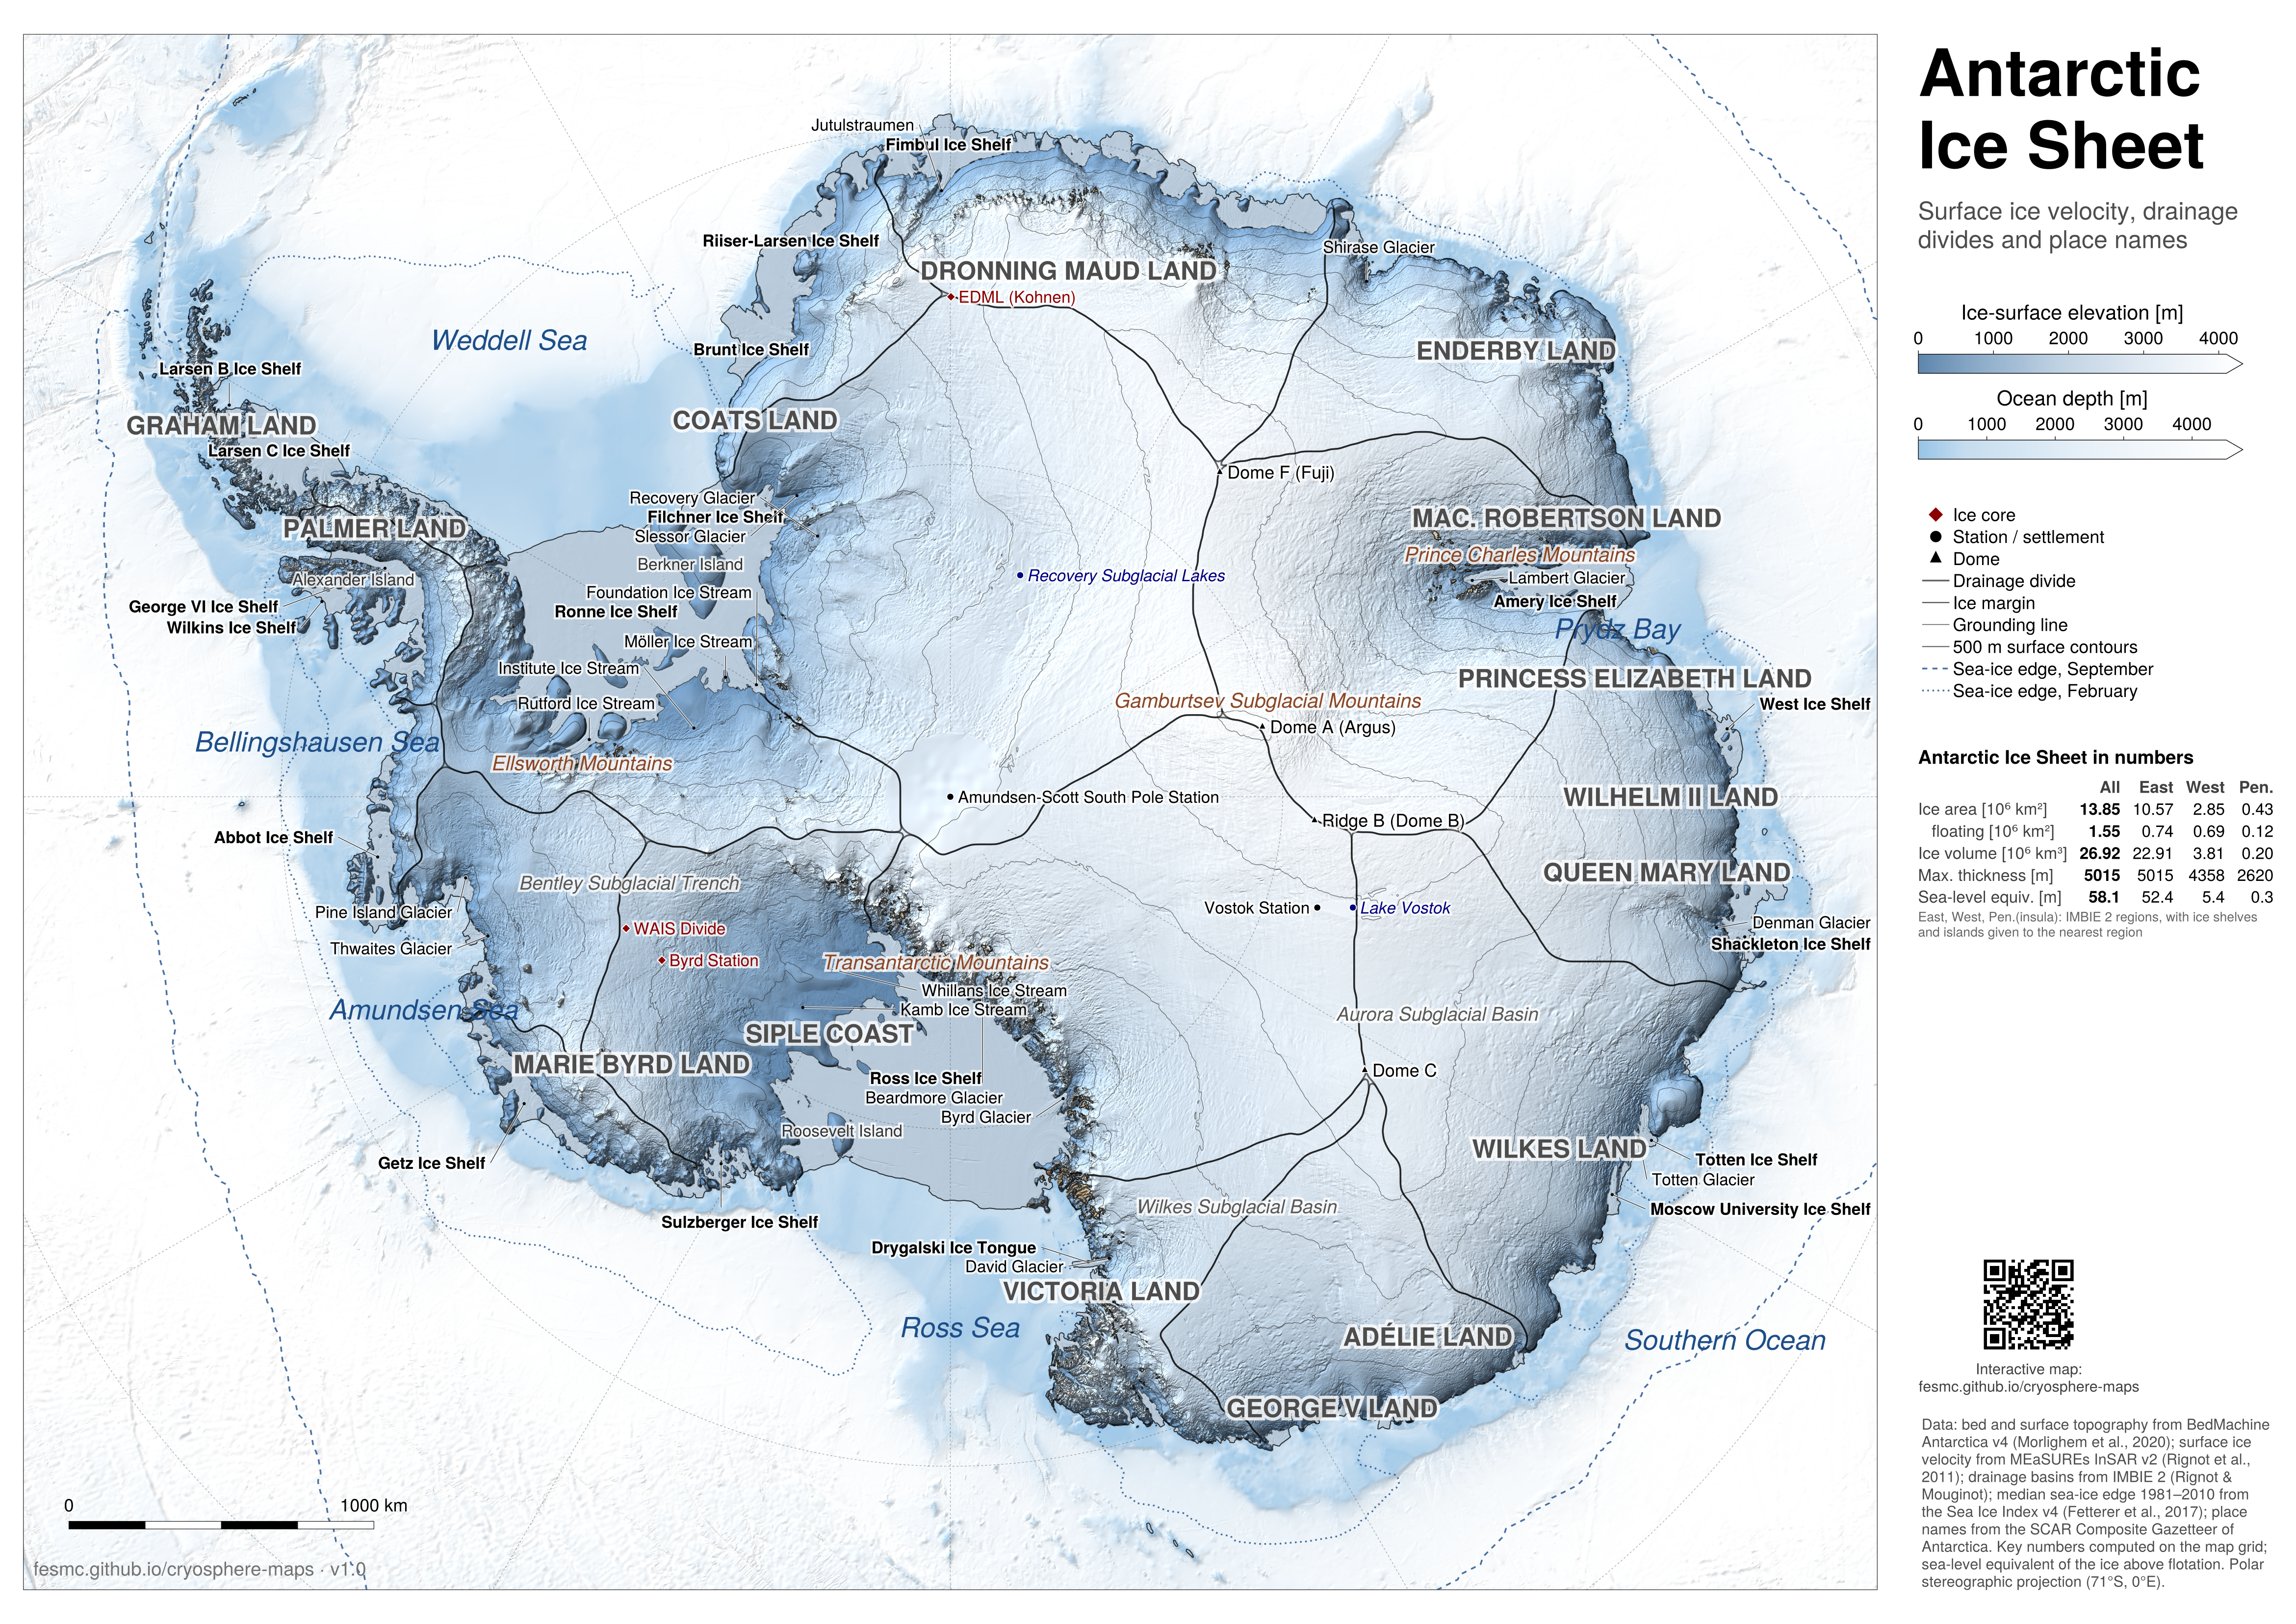
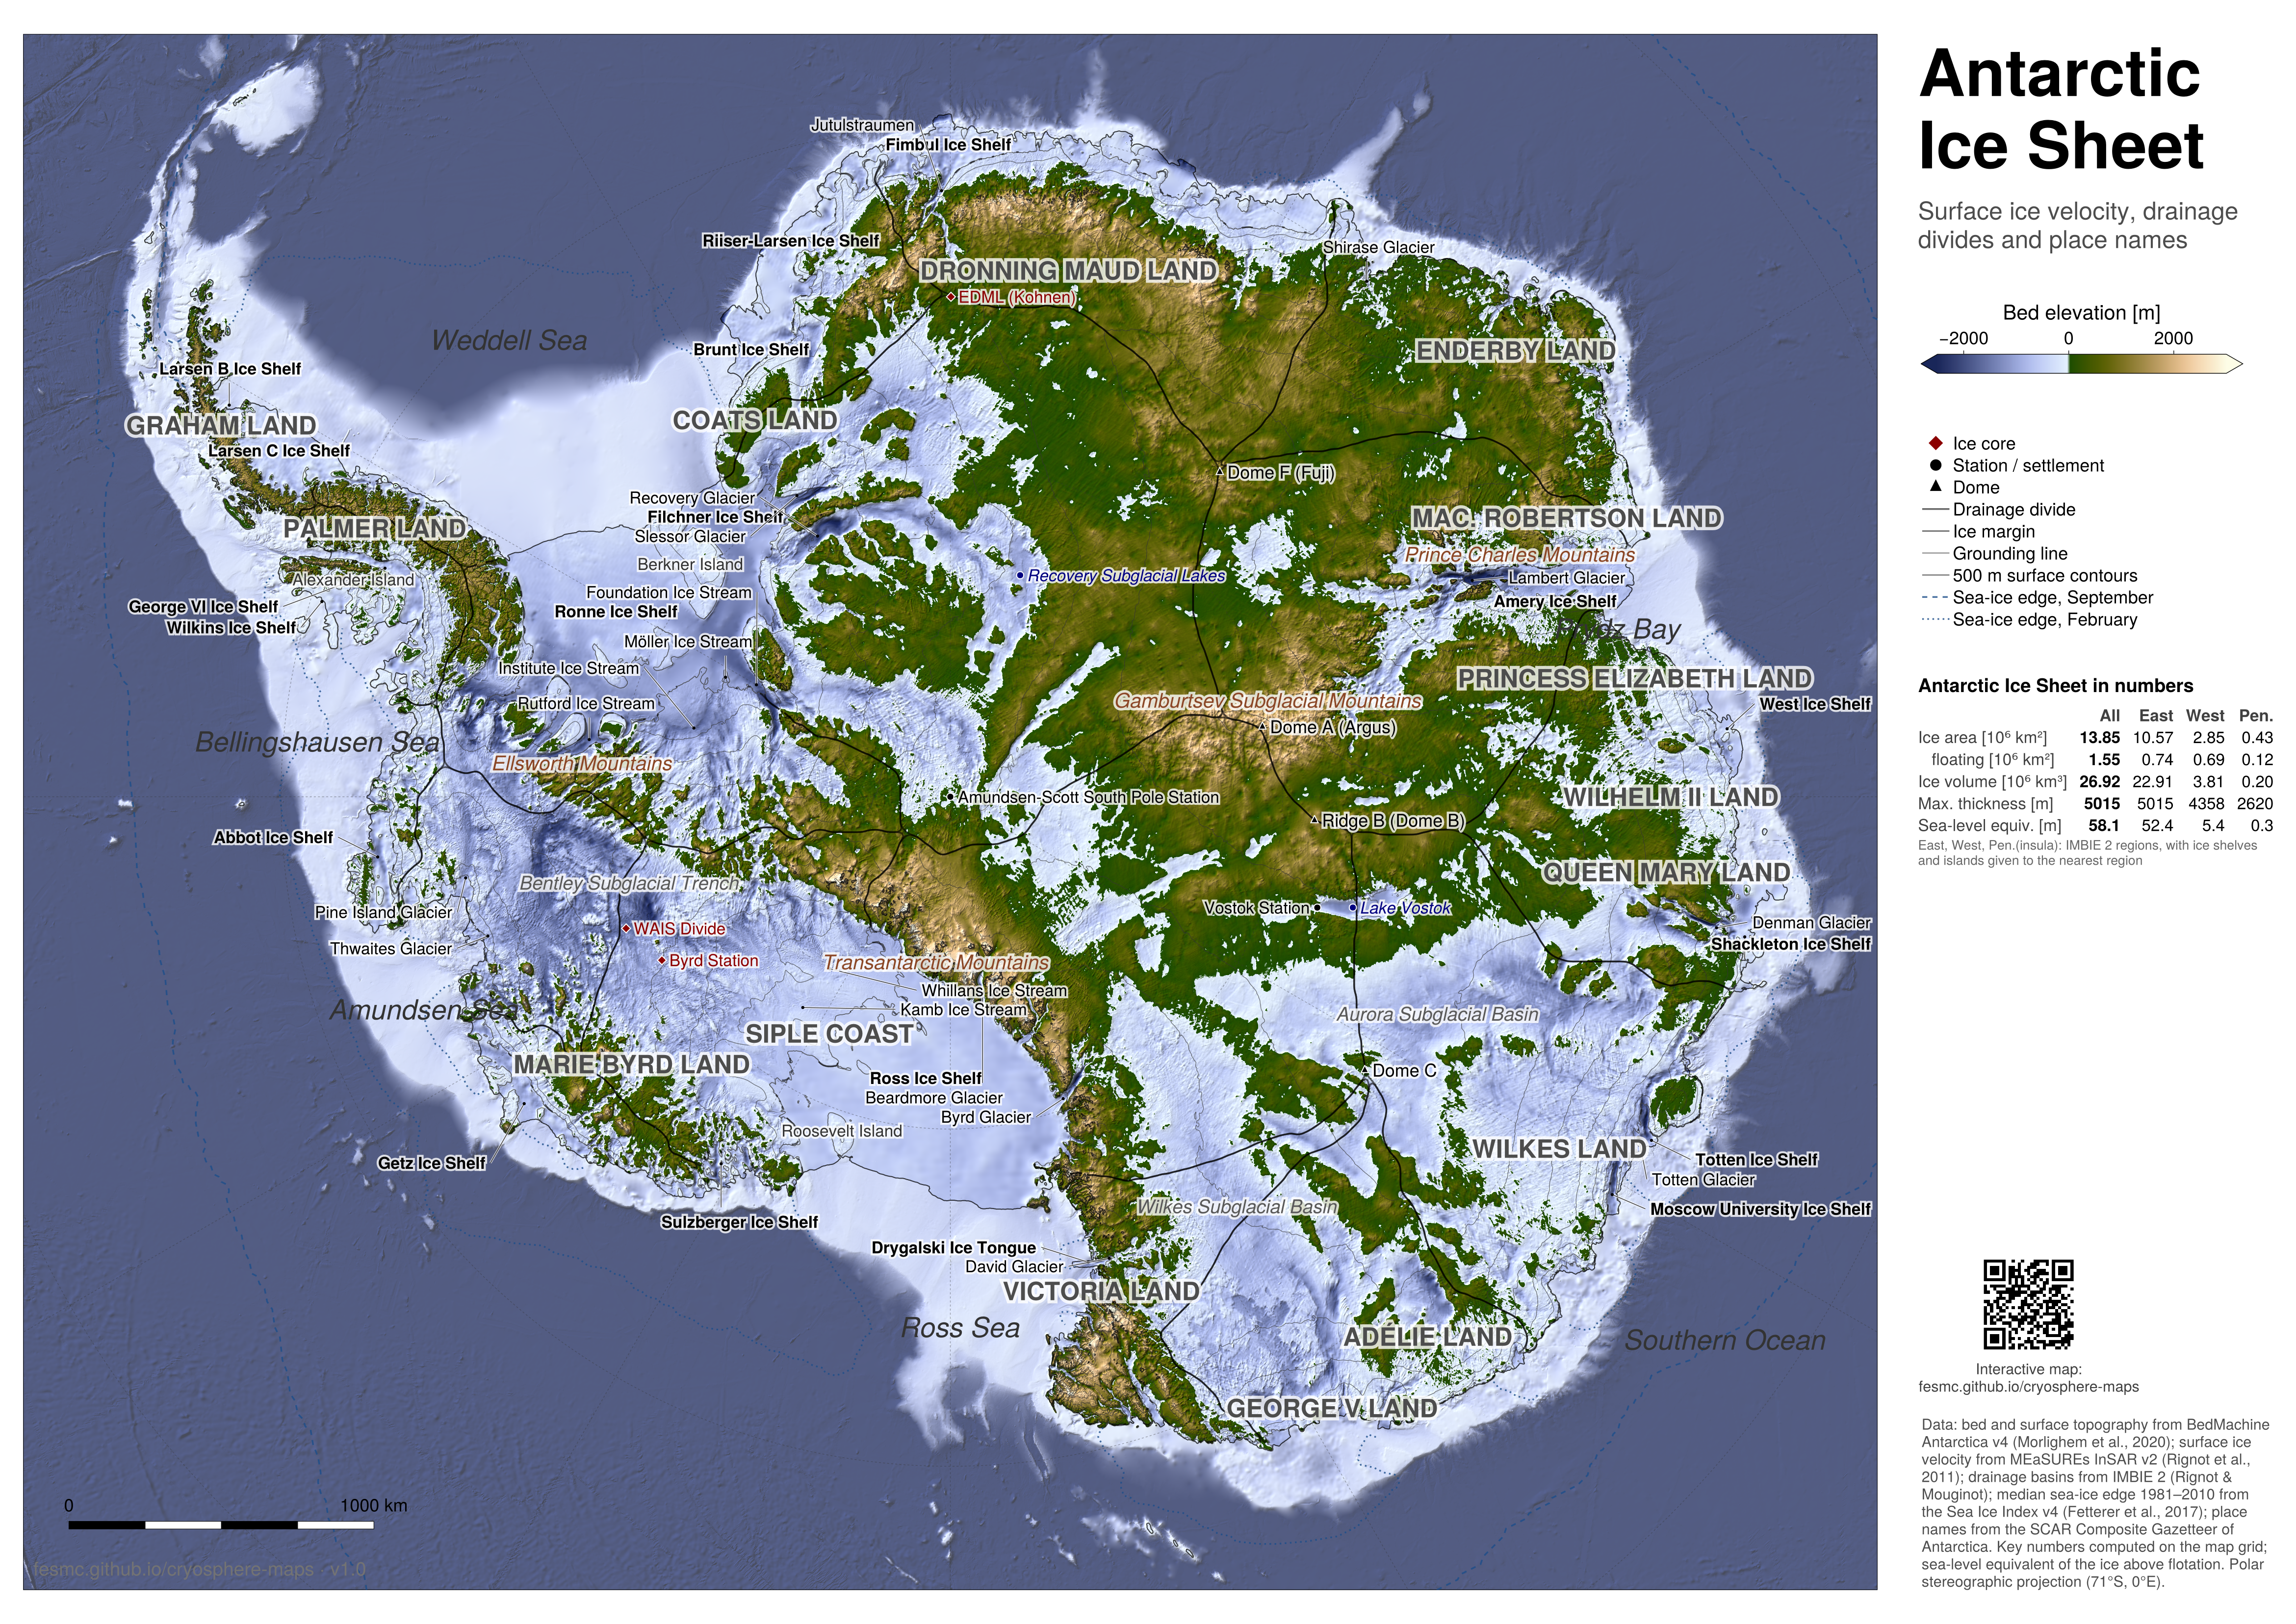
The same at 1 km, with drainage basins, the grounding line and the glaciers, ice streams, ice shelves and domes of the SCAR Composite Gazetteer.
Posters
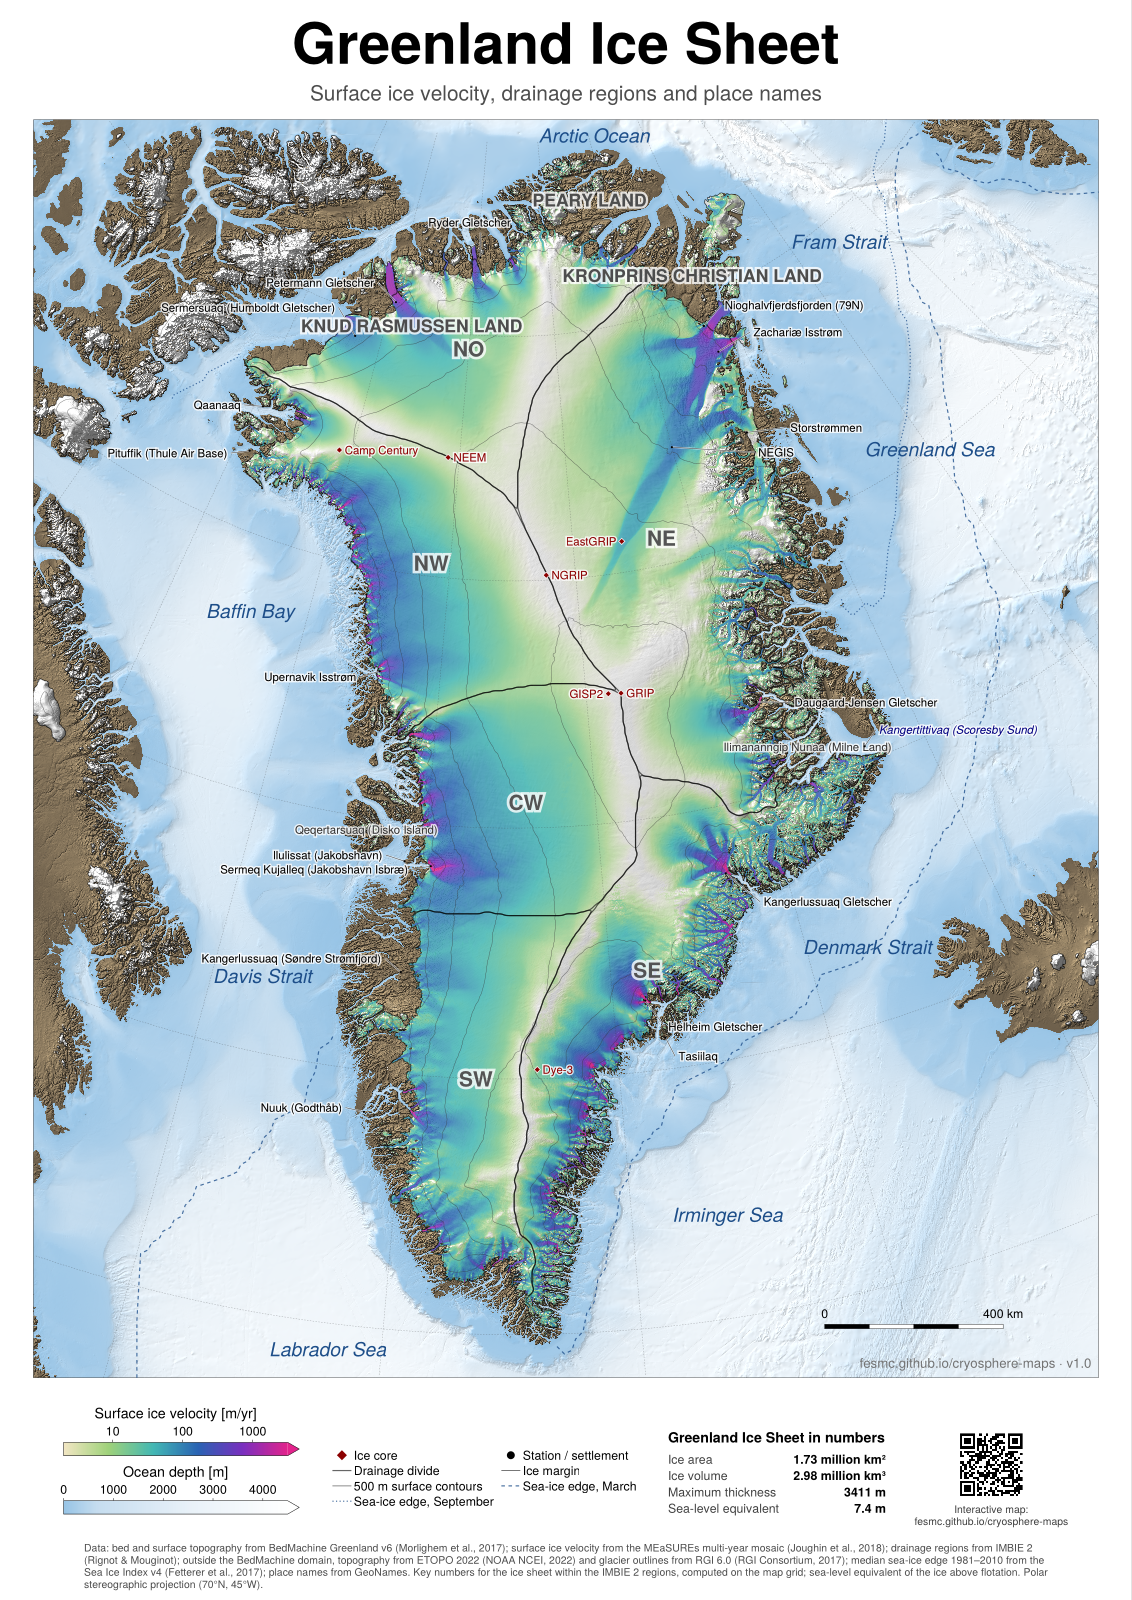
Greenland: ice velocity · PDF, A0, 41 MB · PNG, 100 dpi, 18 MB
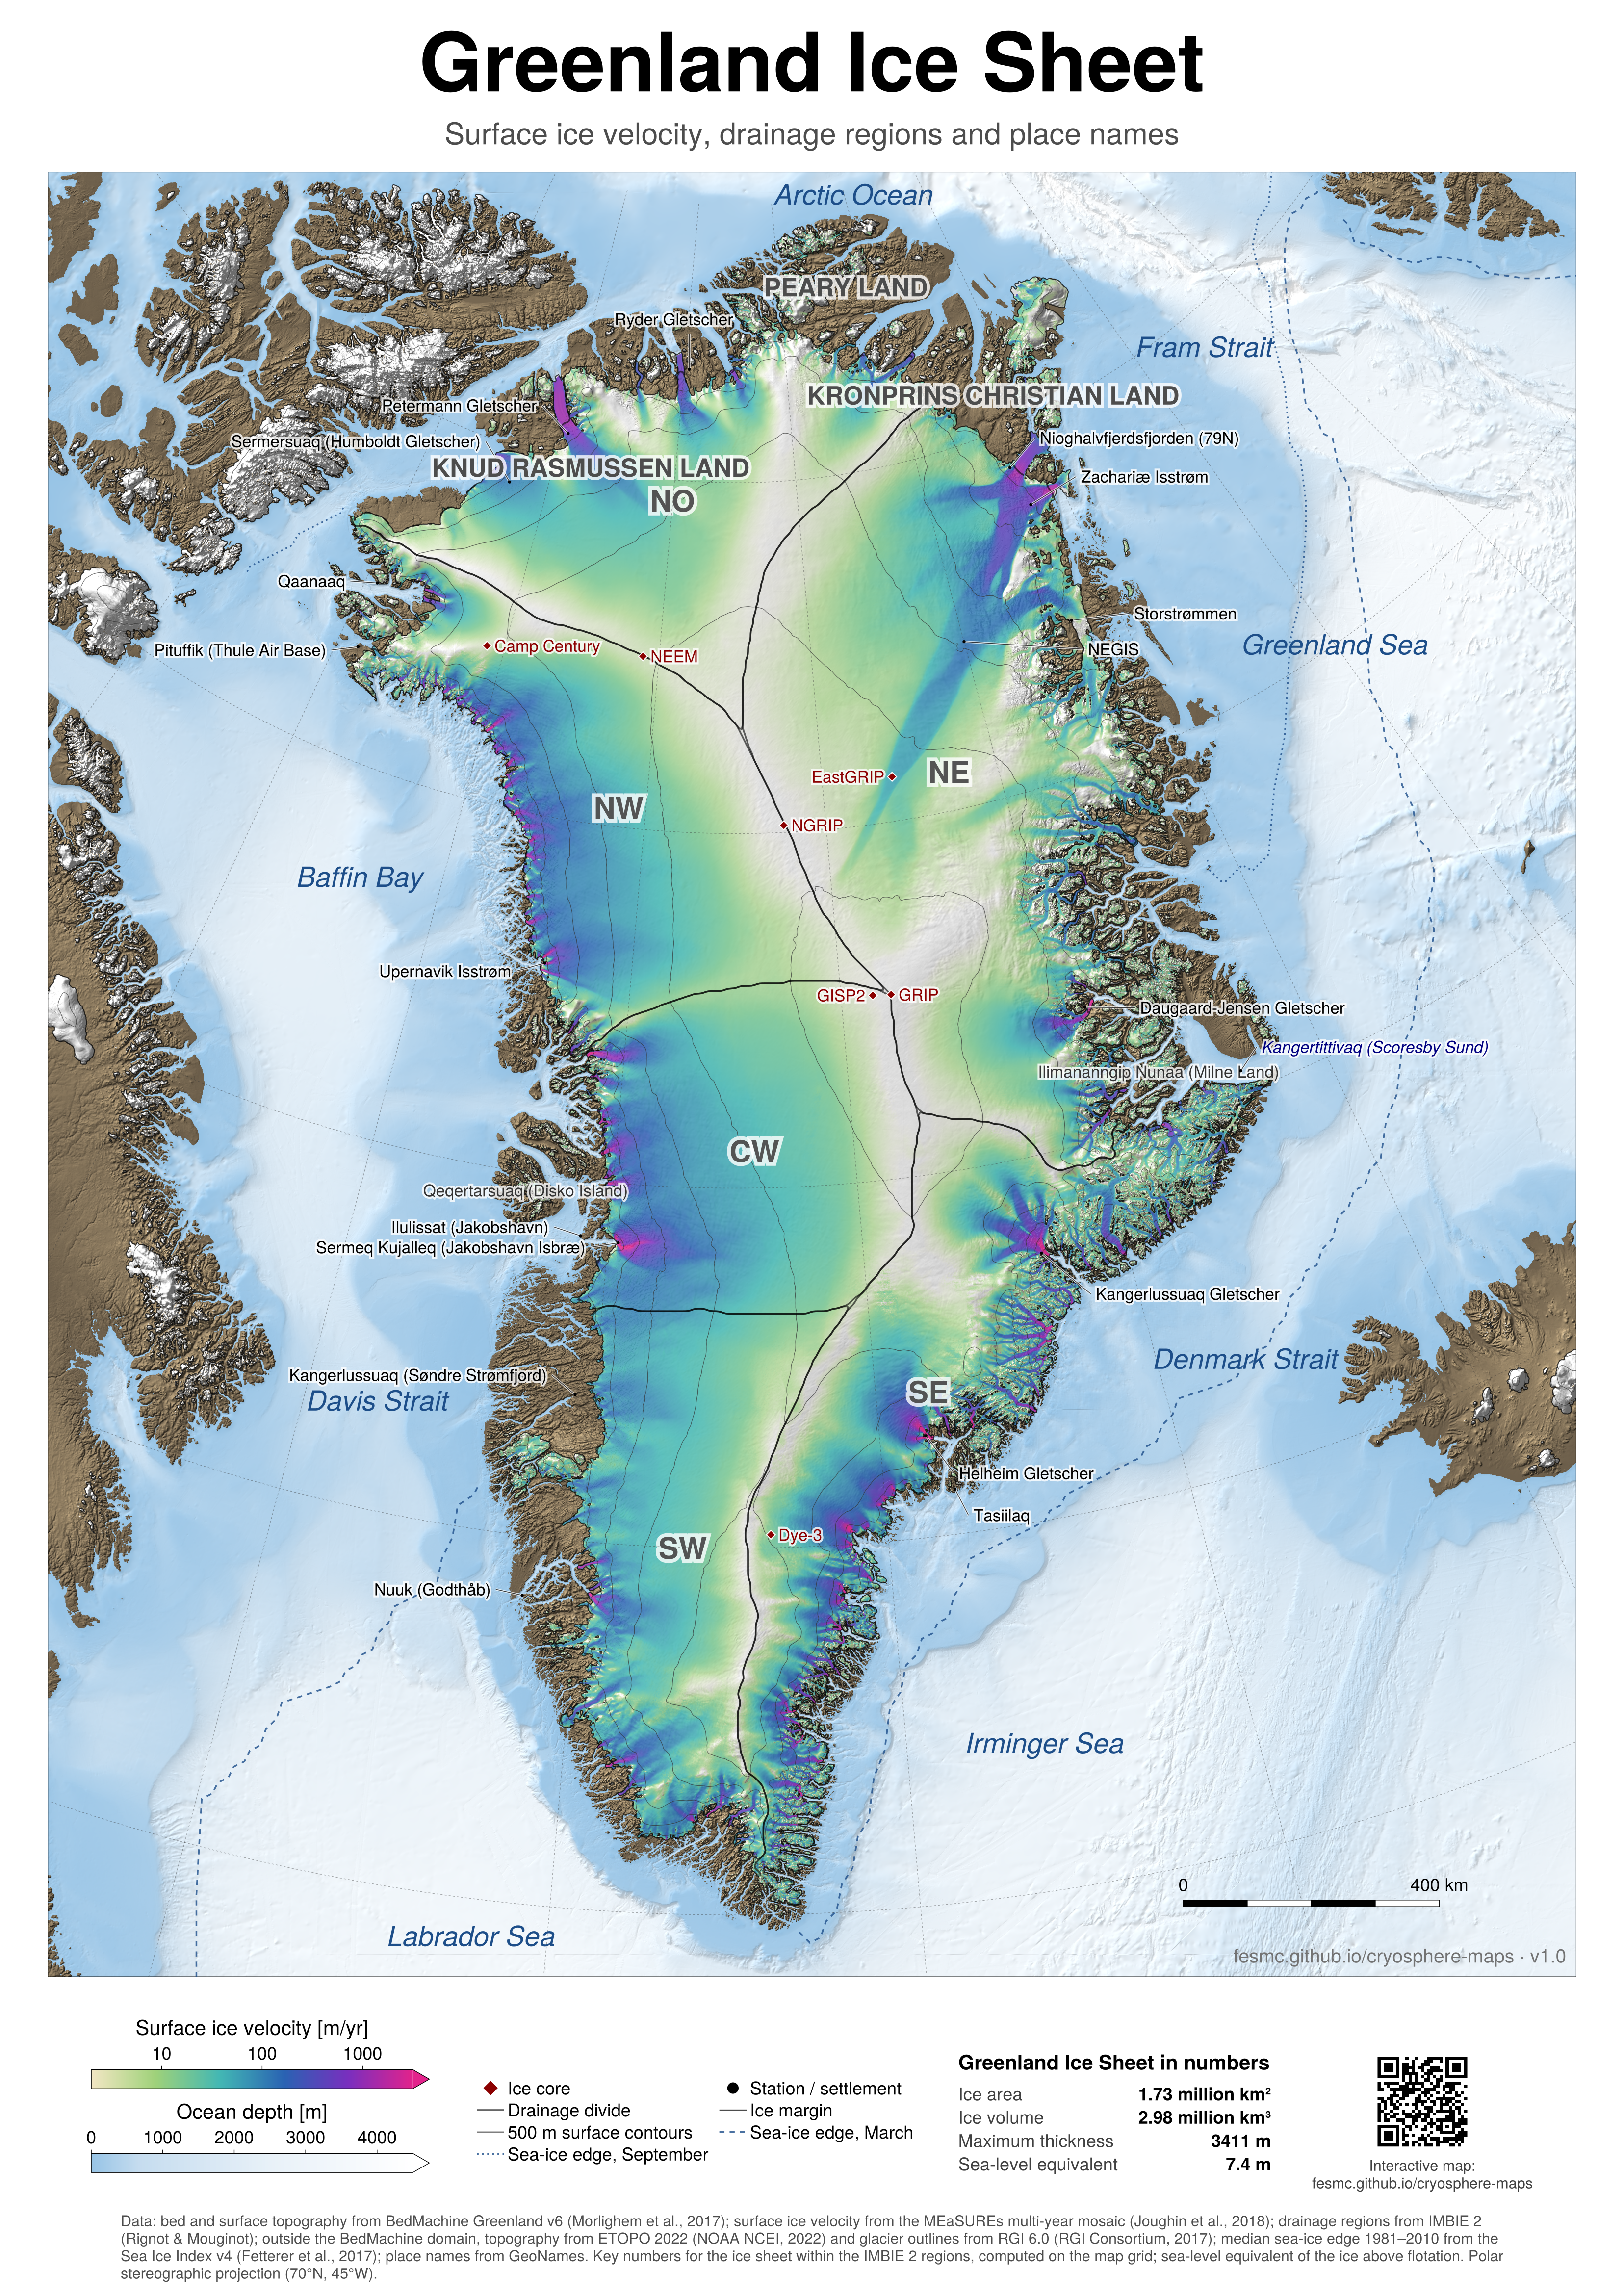
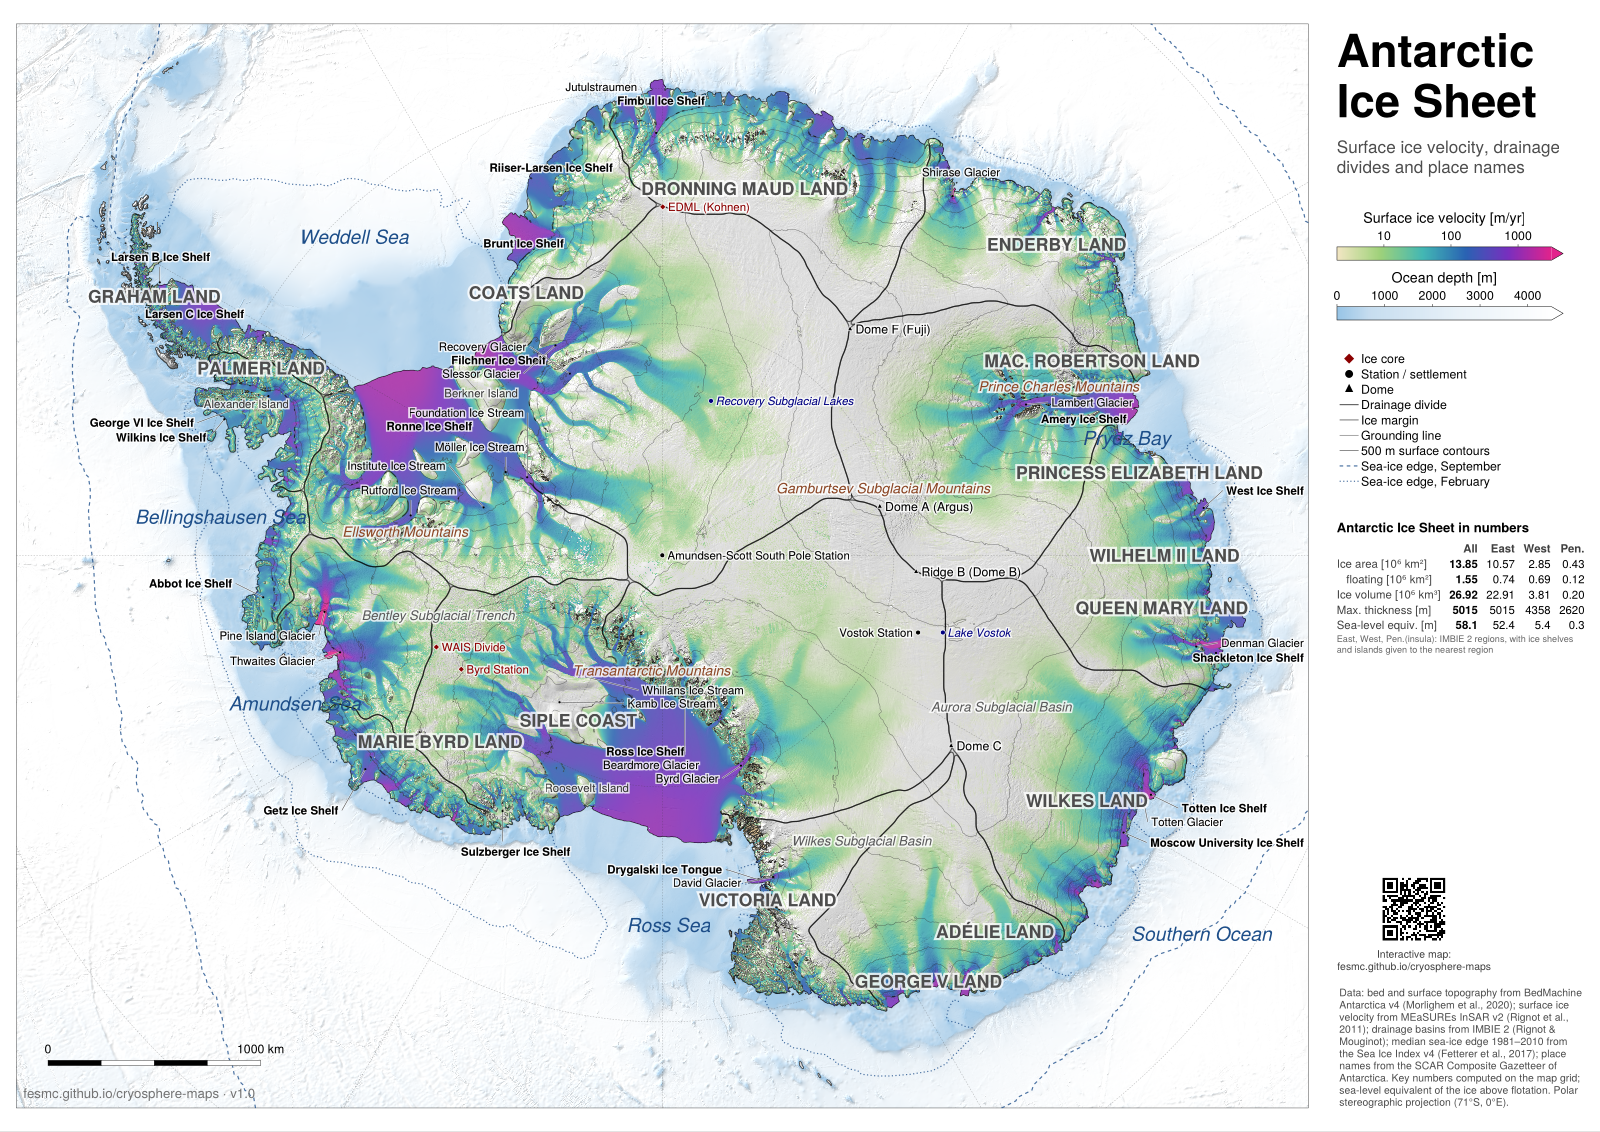
Antarctica: ice velocity · PDF, A0, 44 MB · PNG, 100 dpi, 17 MB
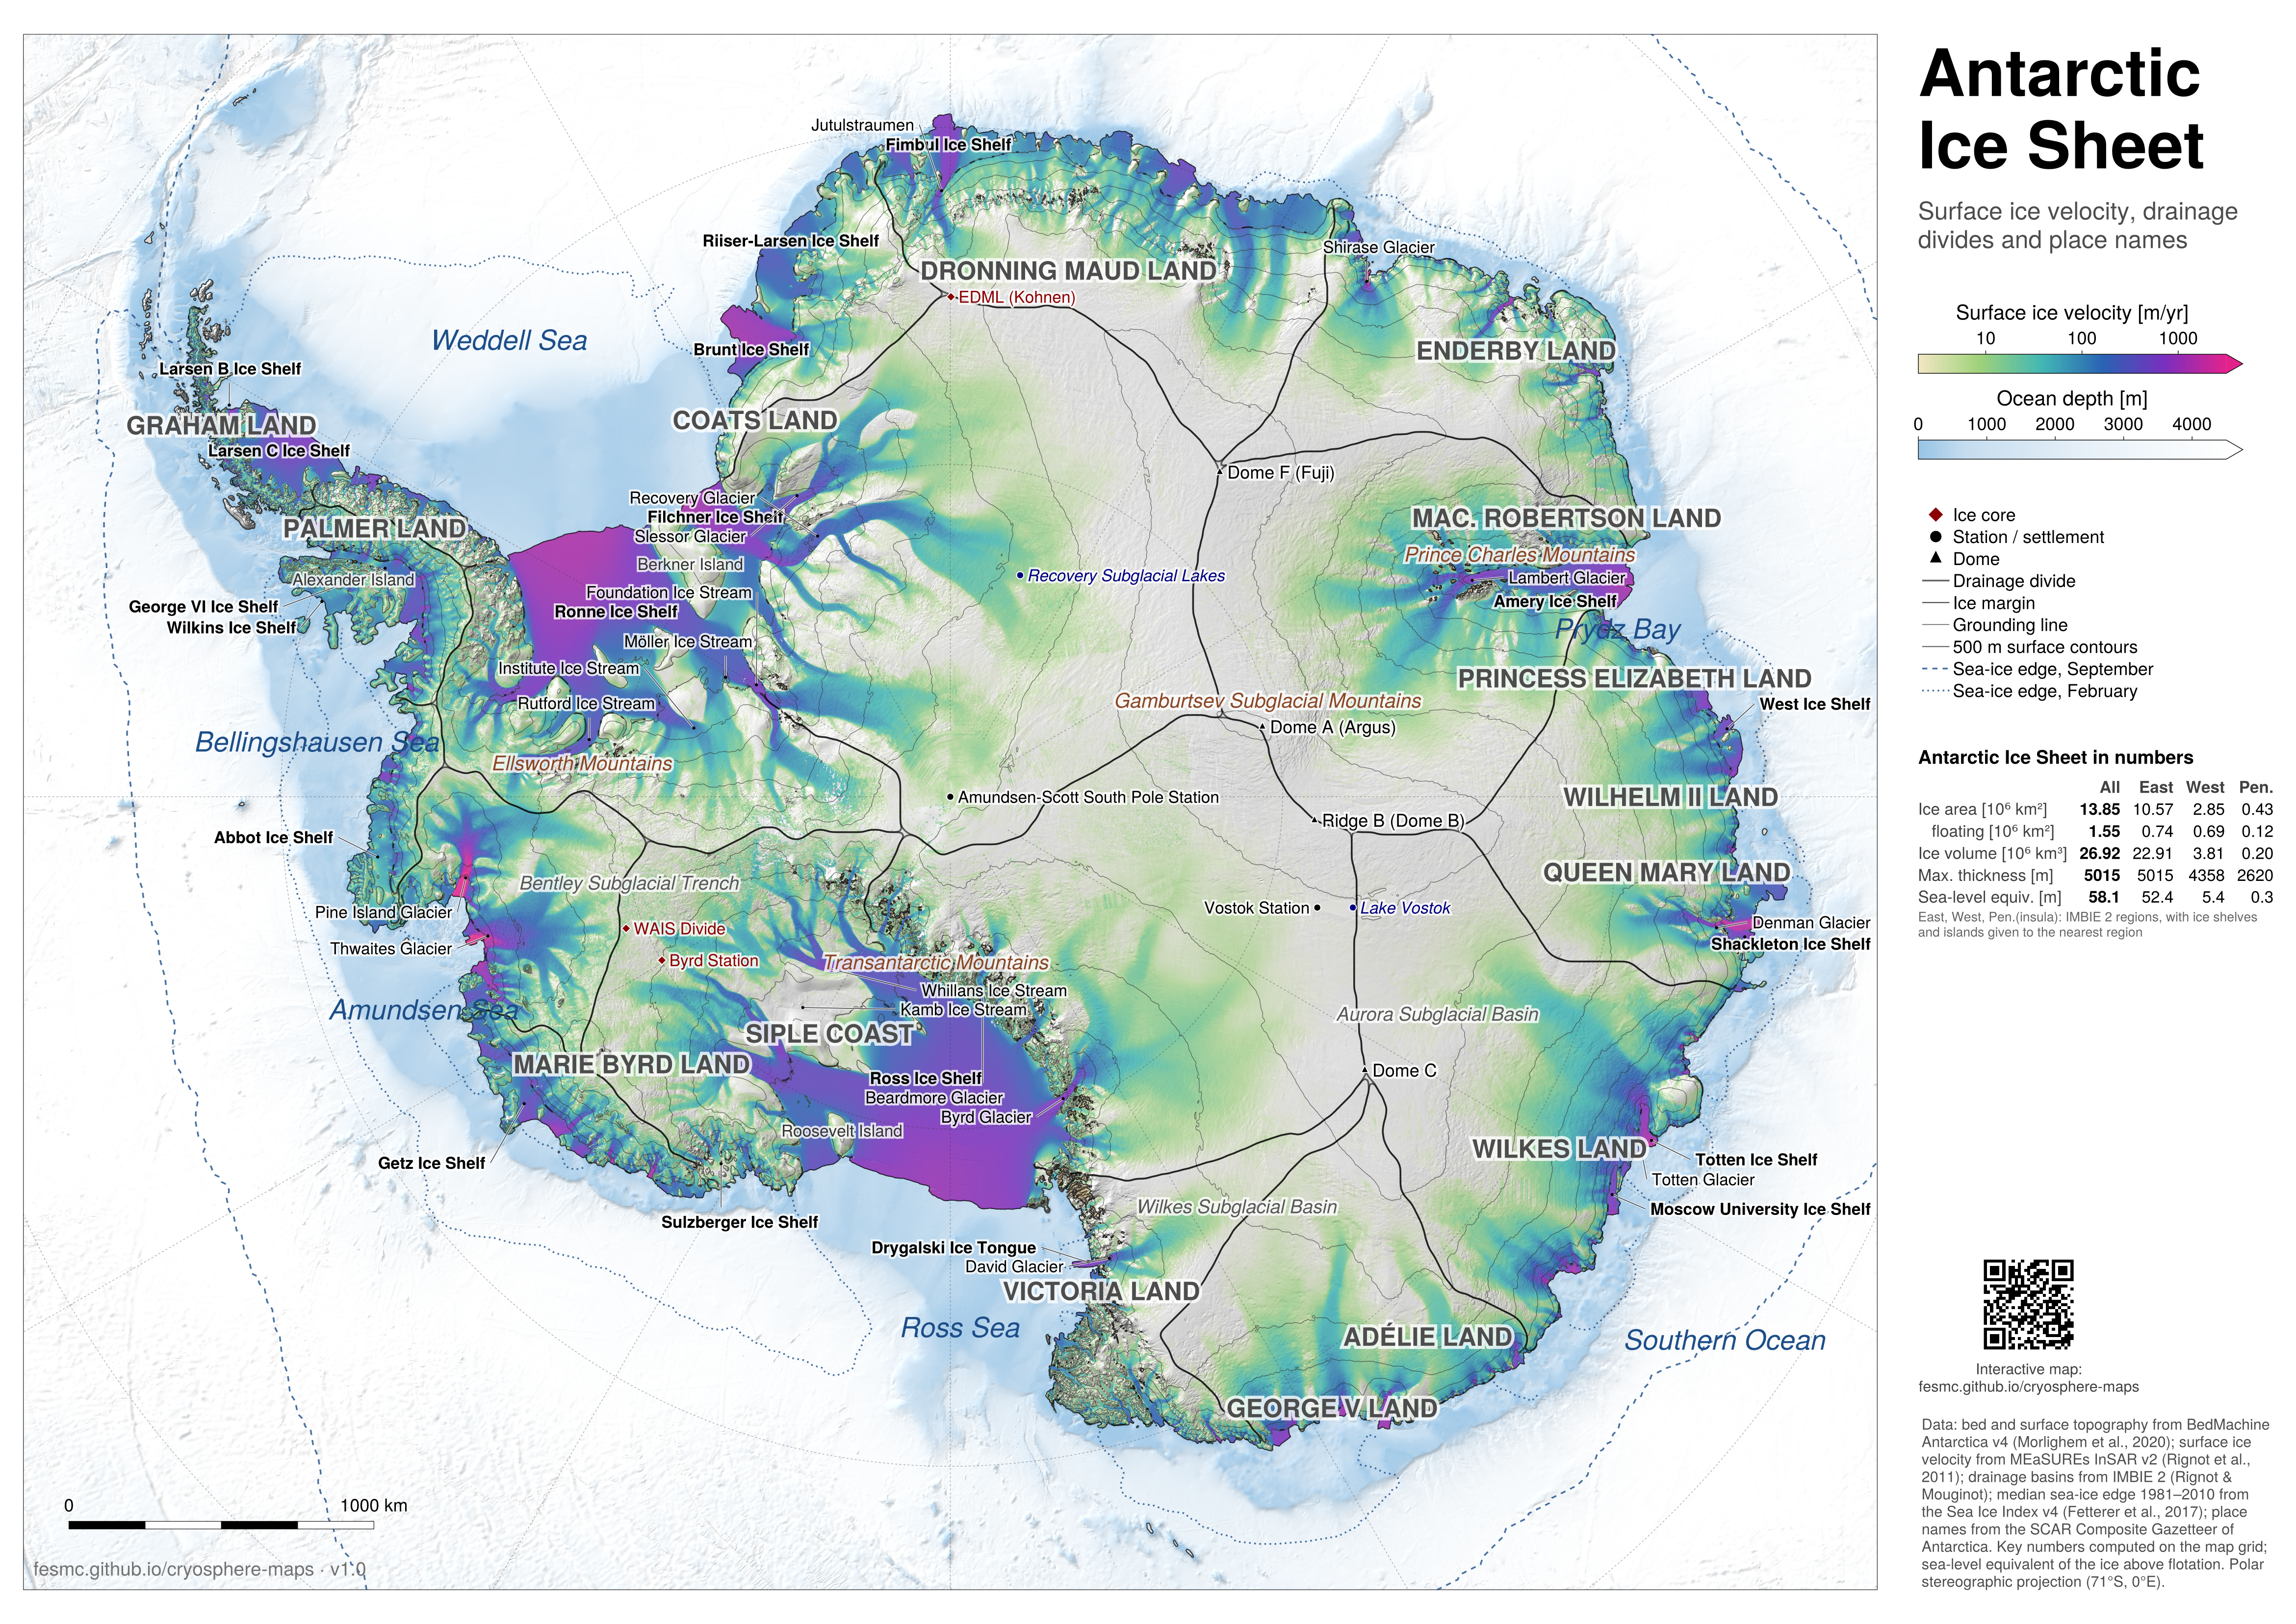
Variants
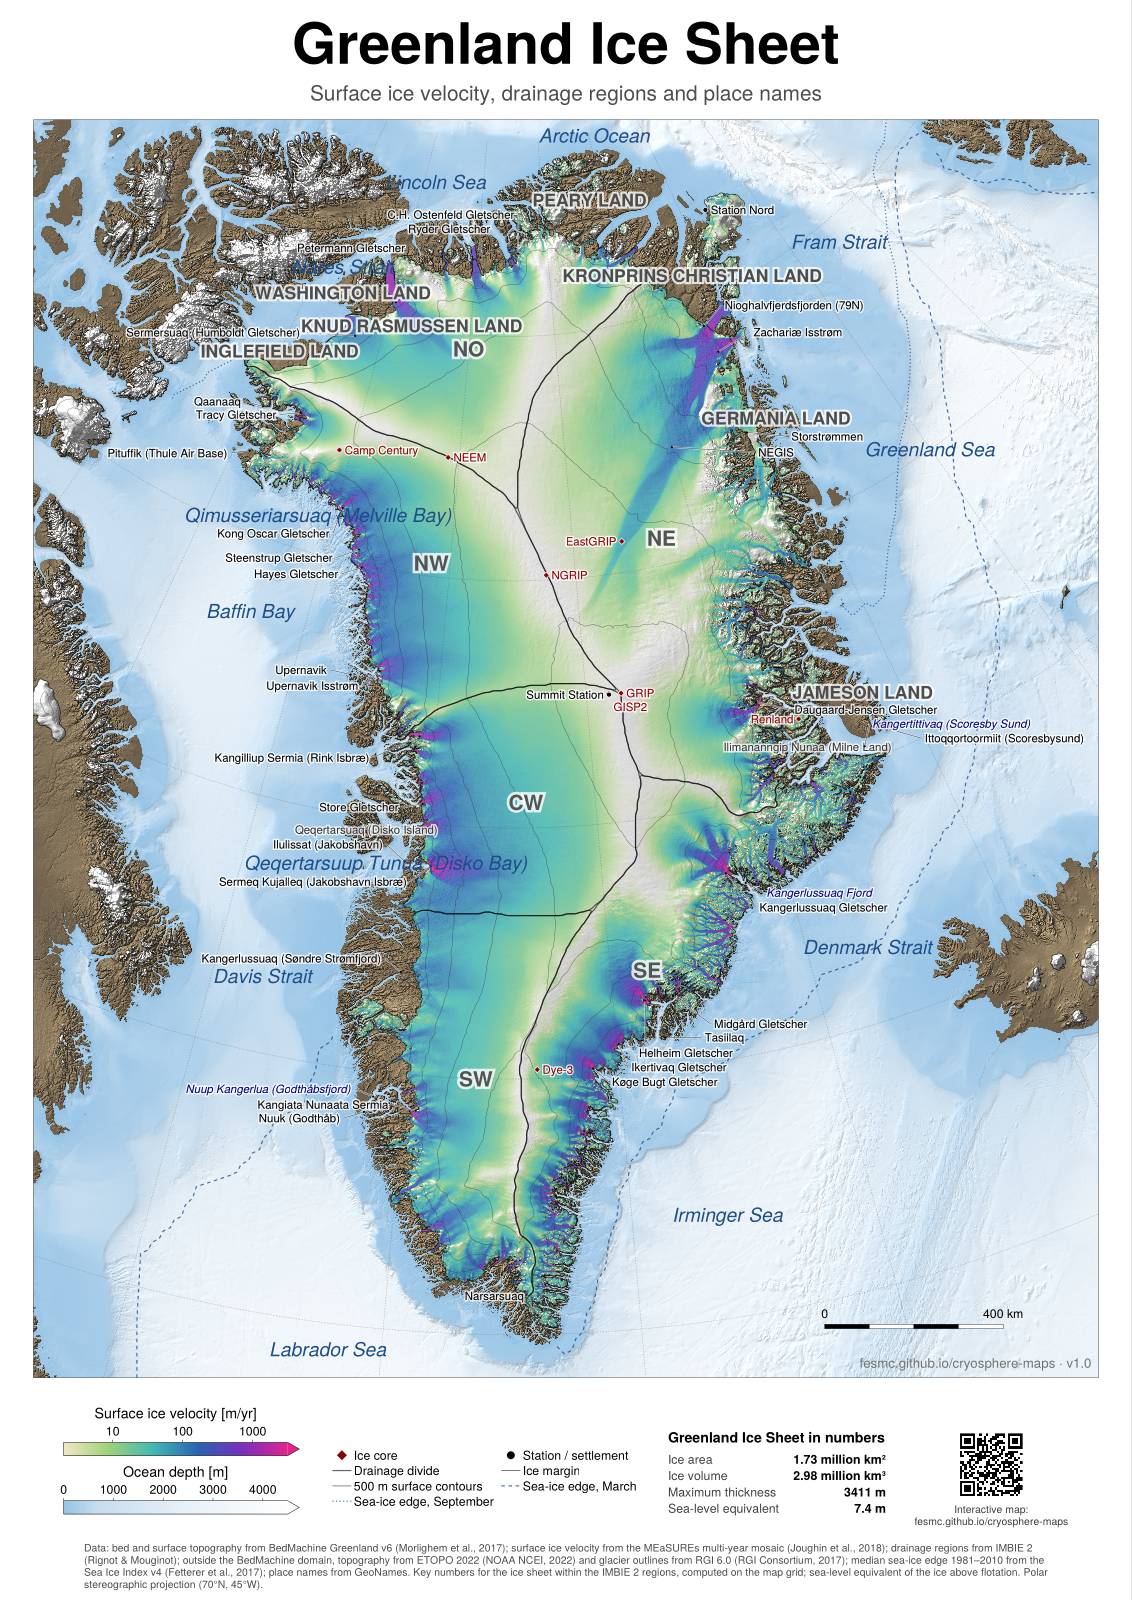
Greenland: ice velocity, more names · PDF, A0, 41 MB · PNG, 100 dpi, 18 MB
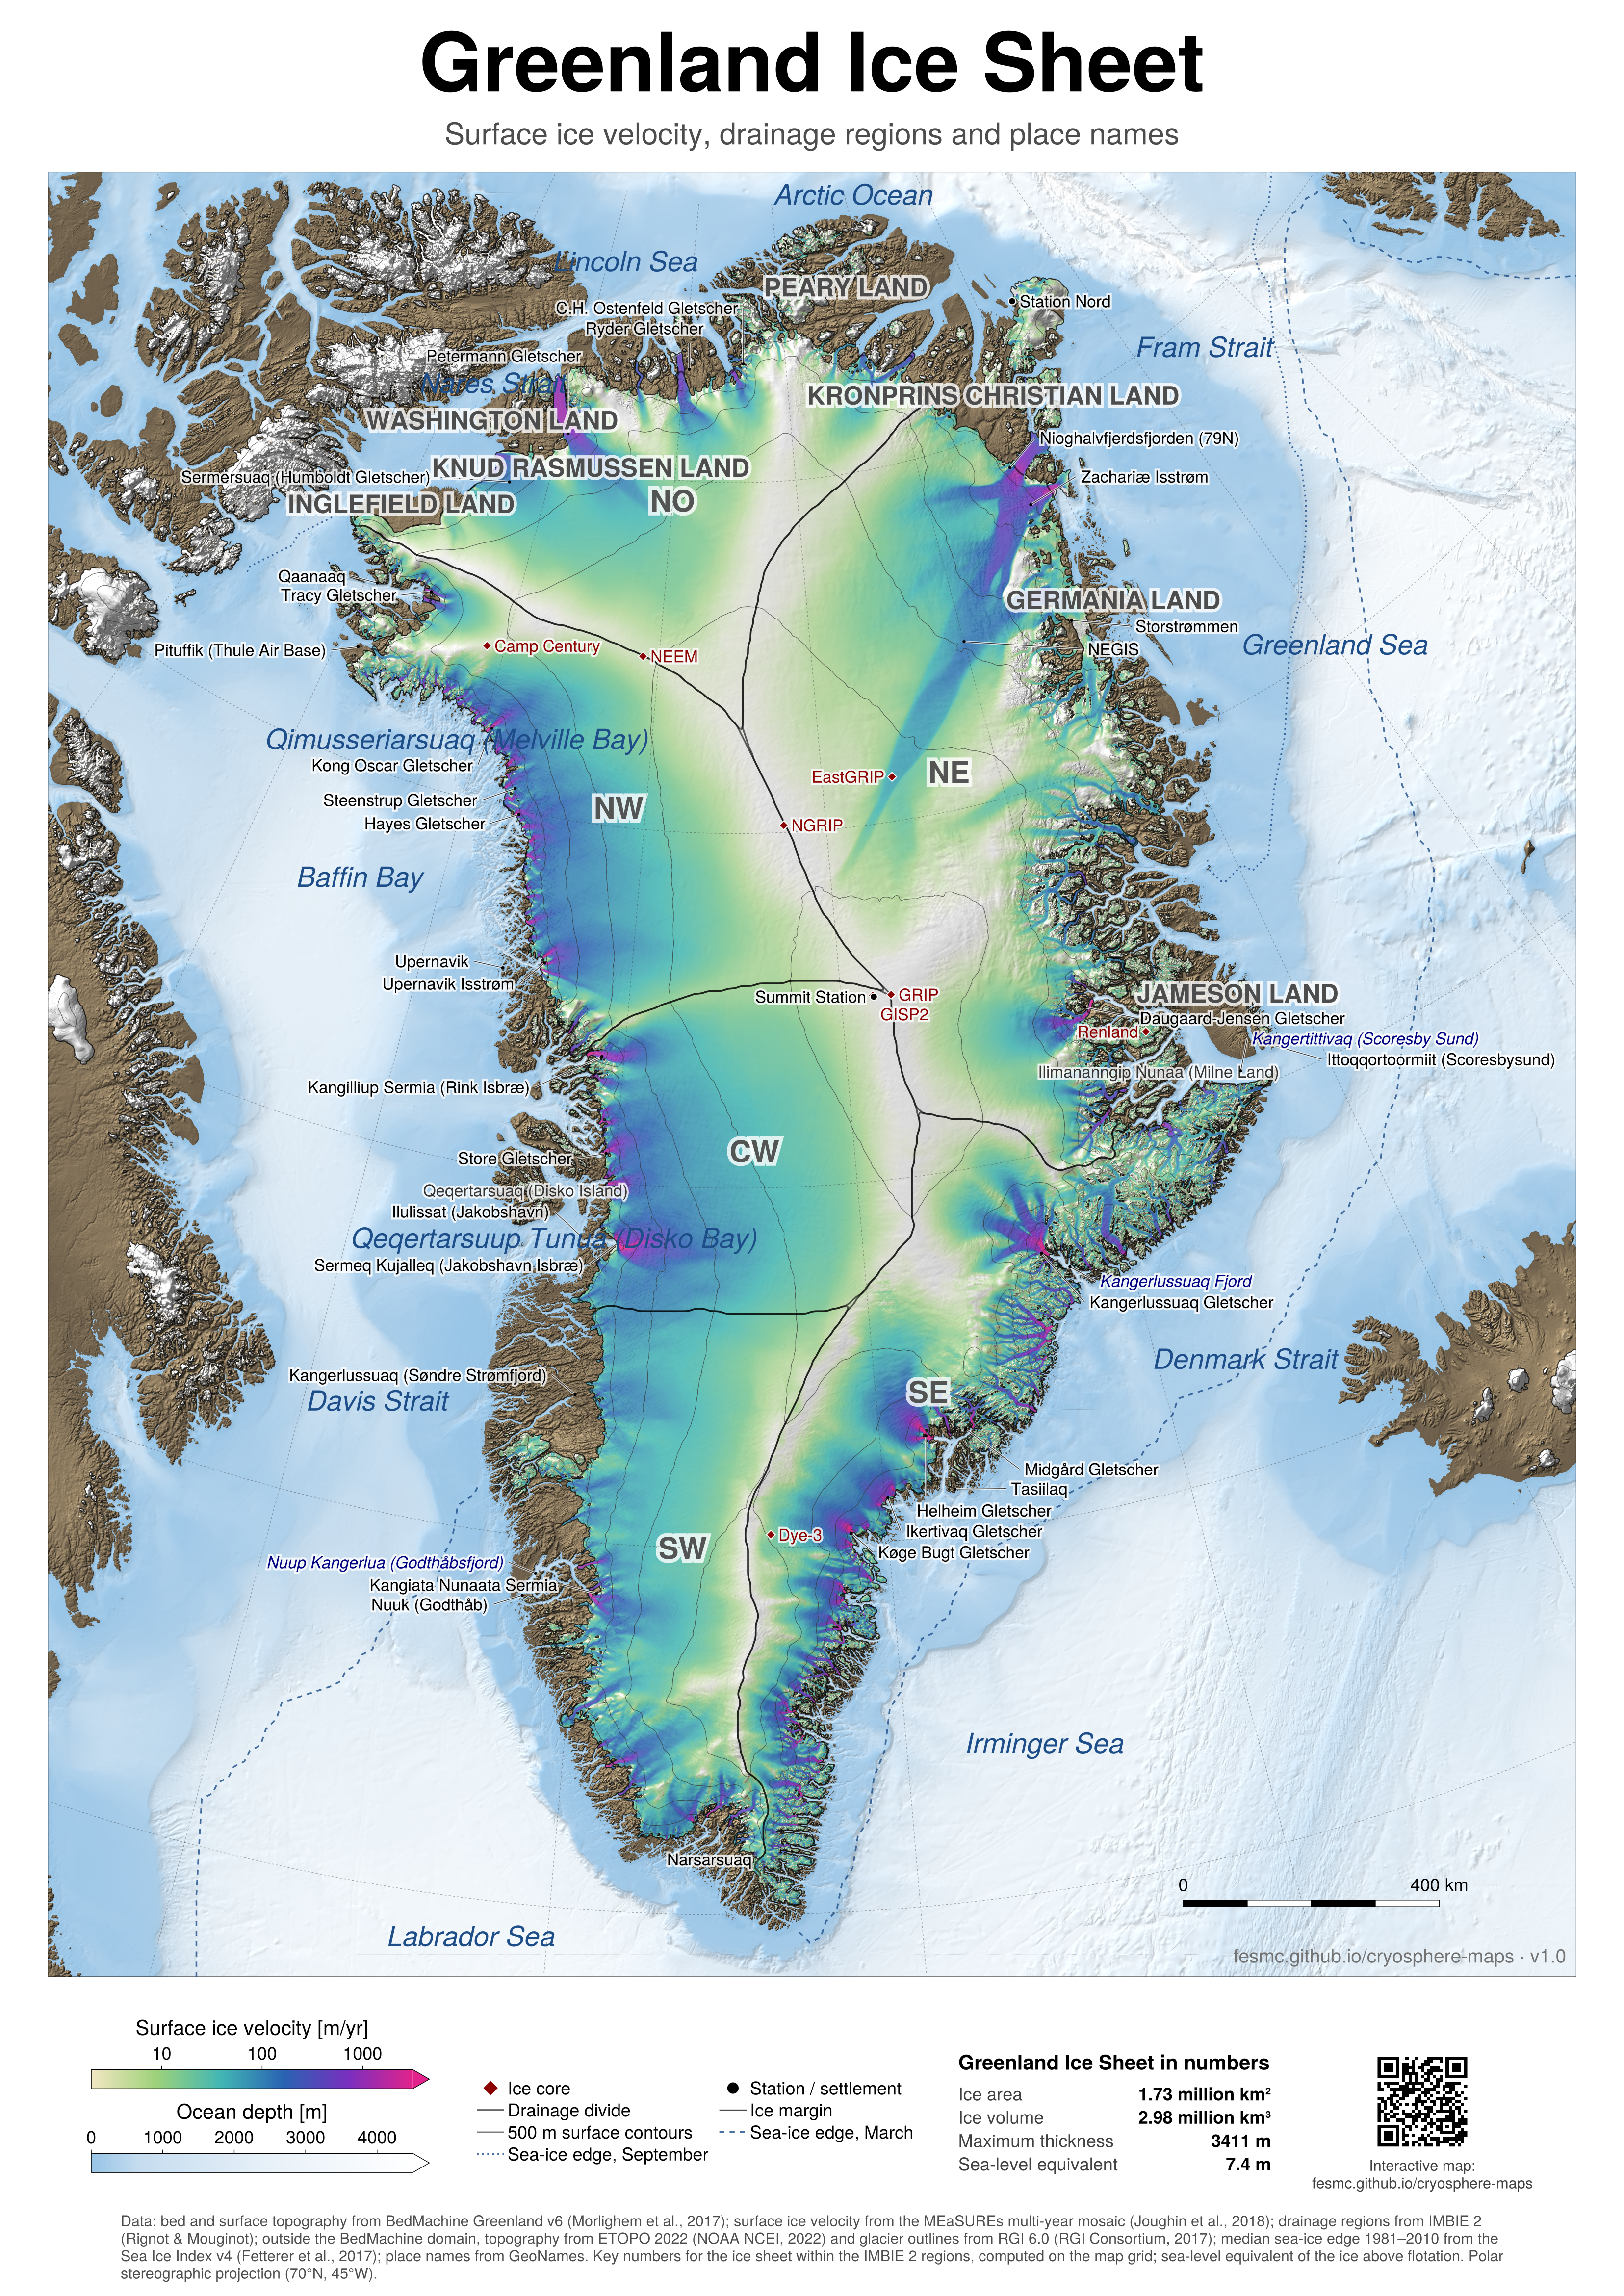
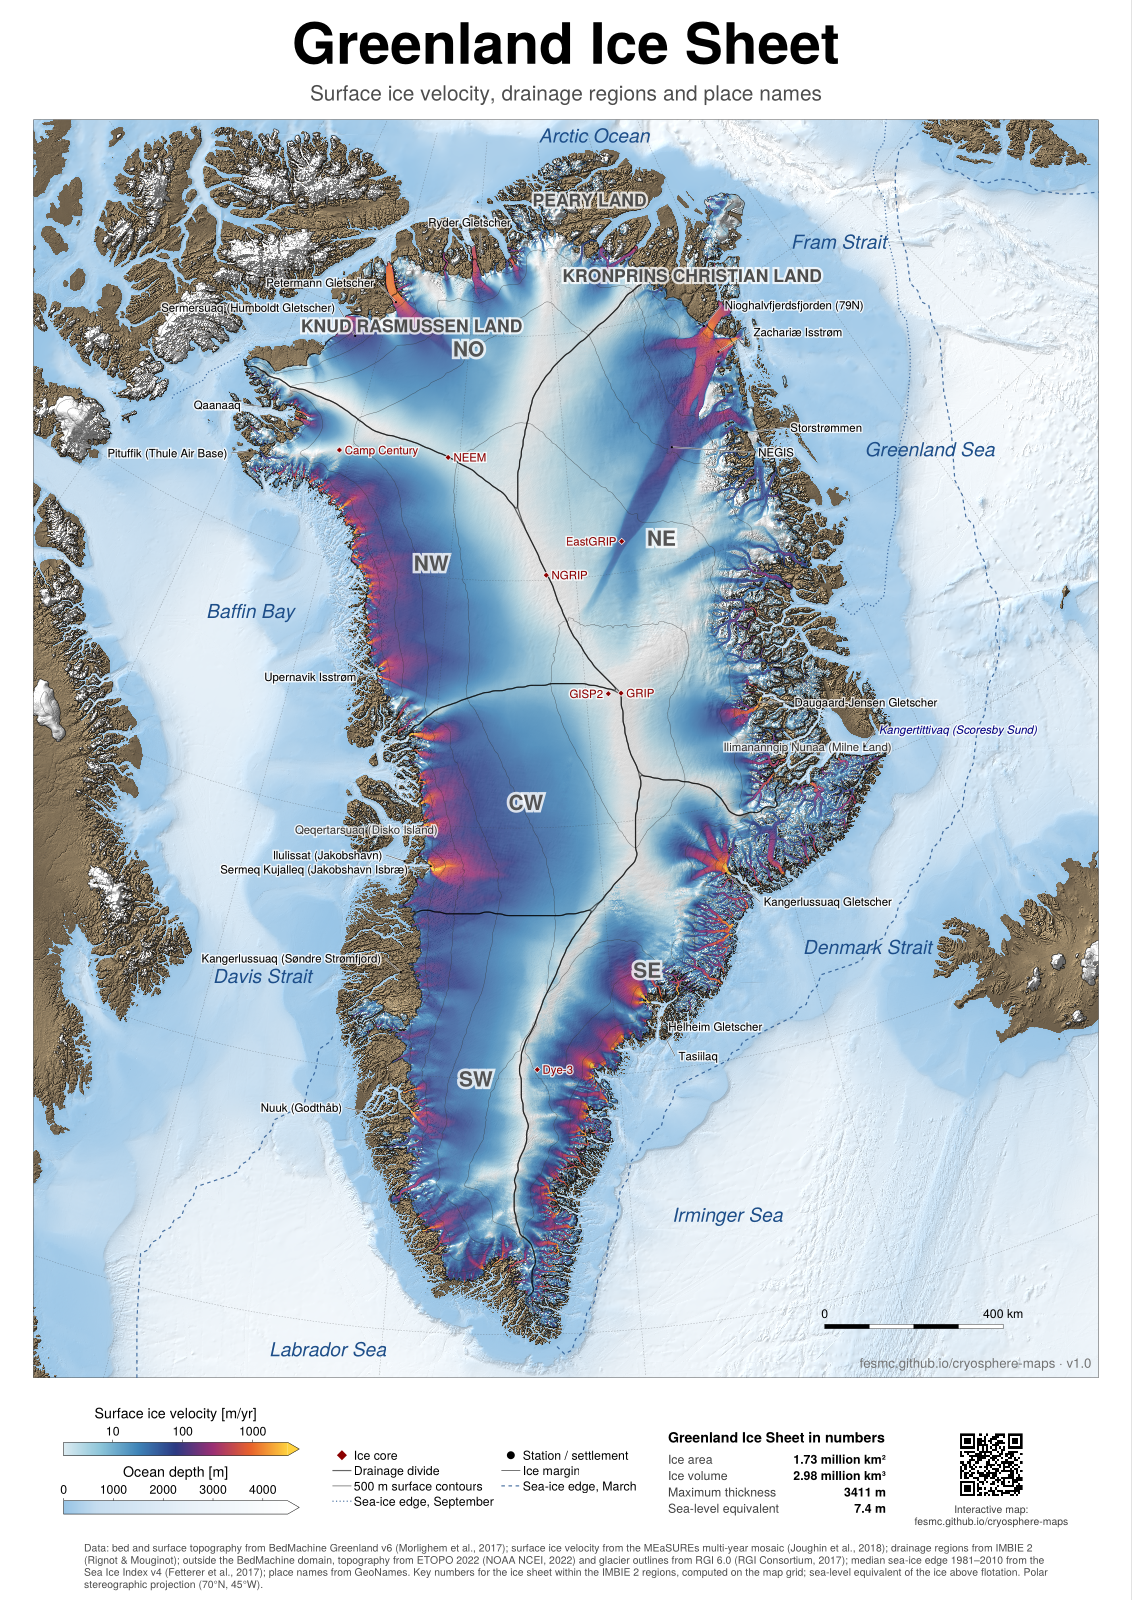
Greenland: ice velocity, ember colours · PDF, A0, 40 MB · PNG, 100 dpi, 18 MB
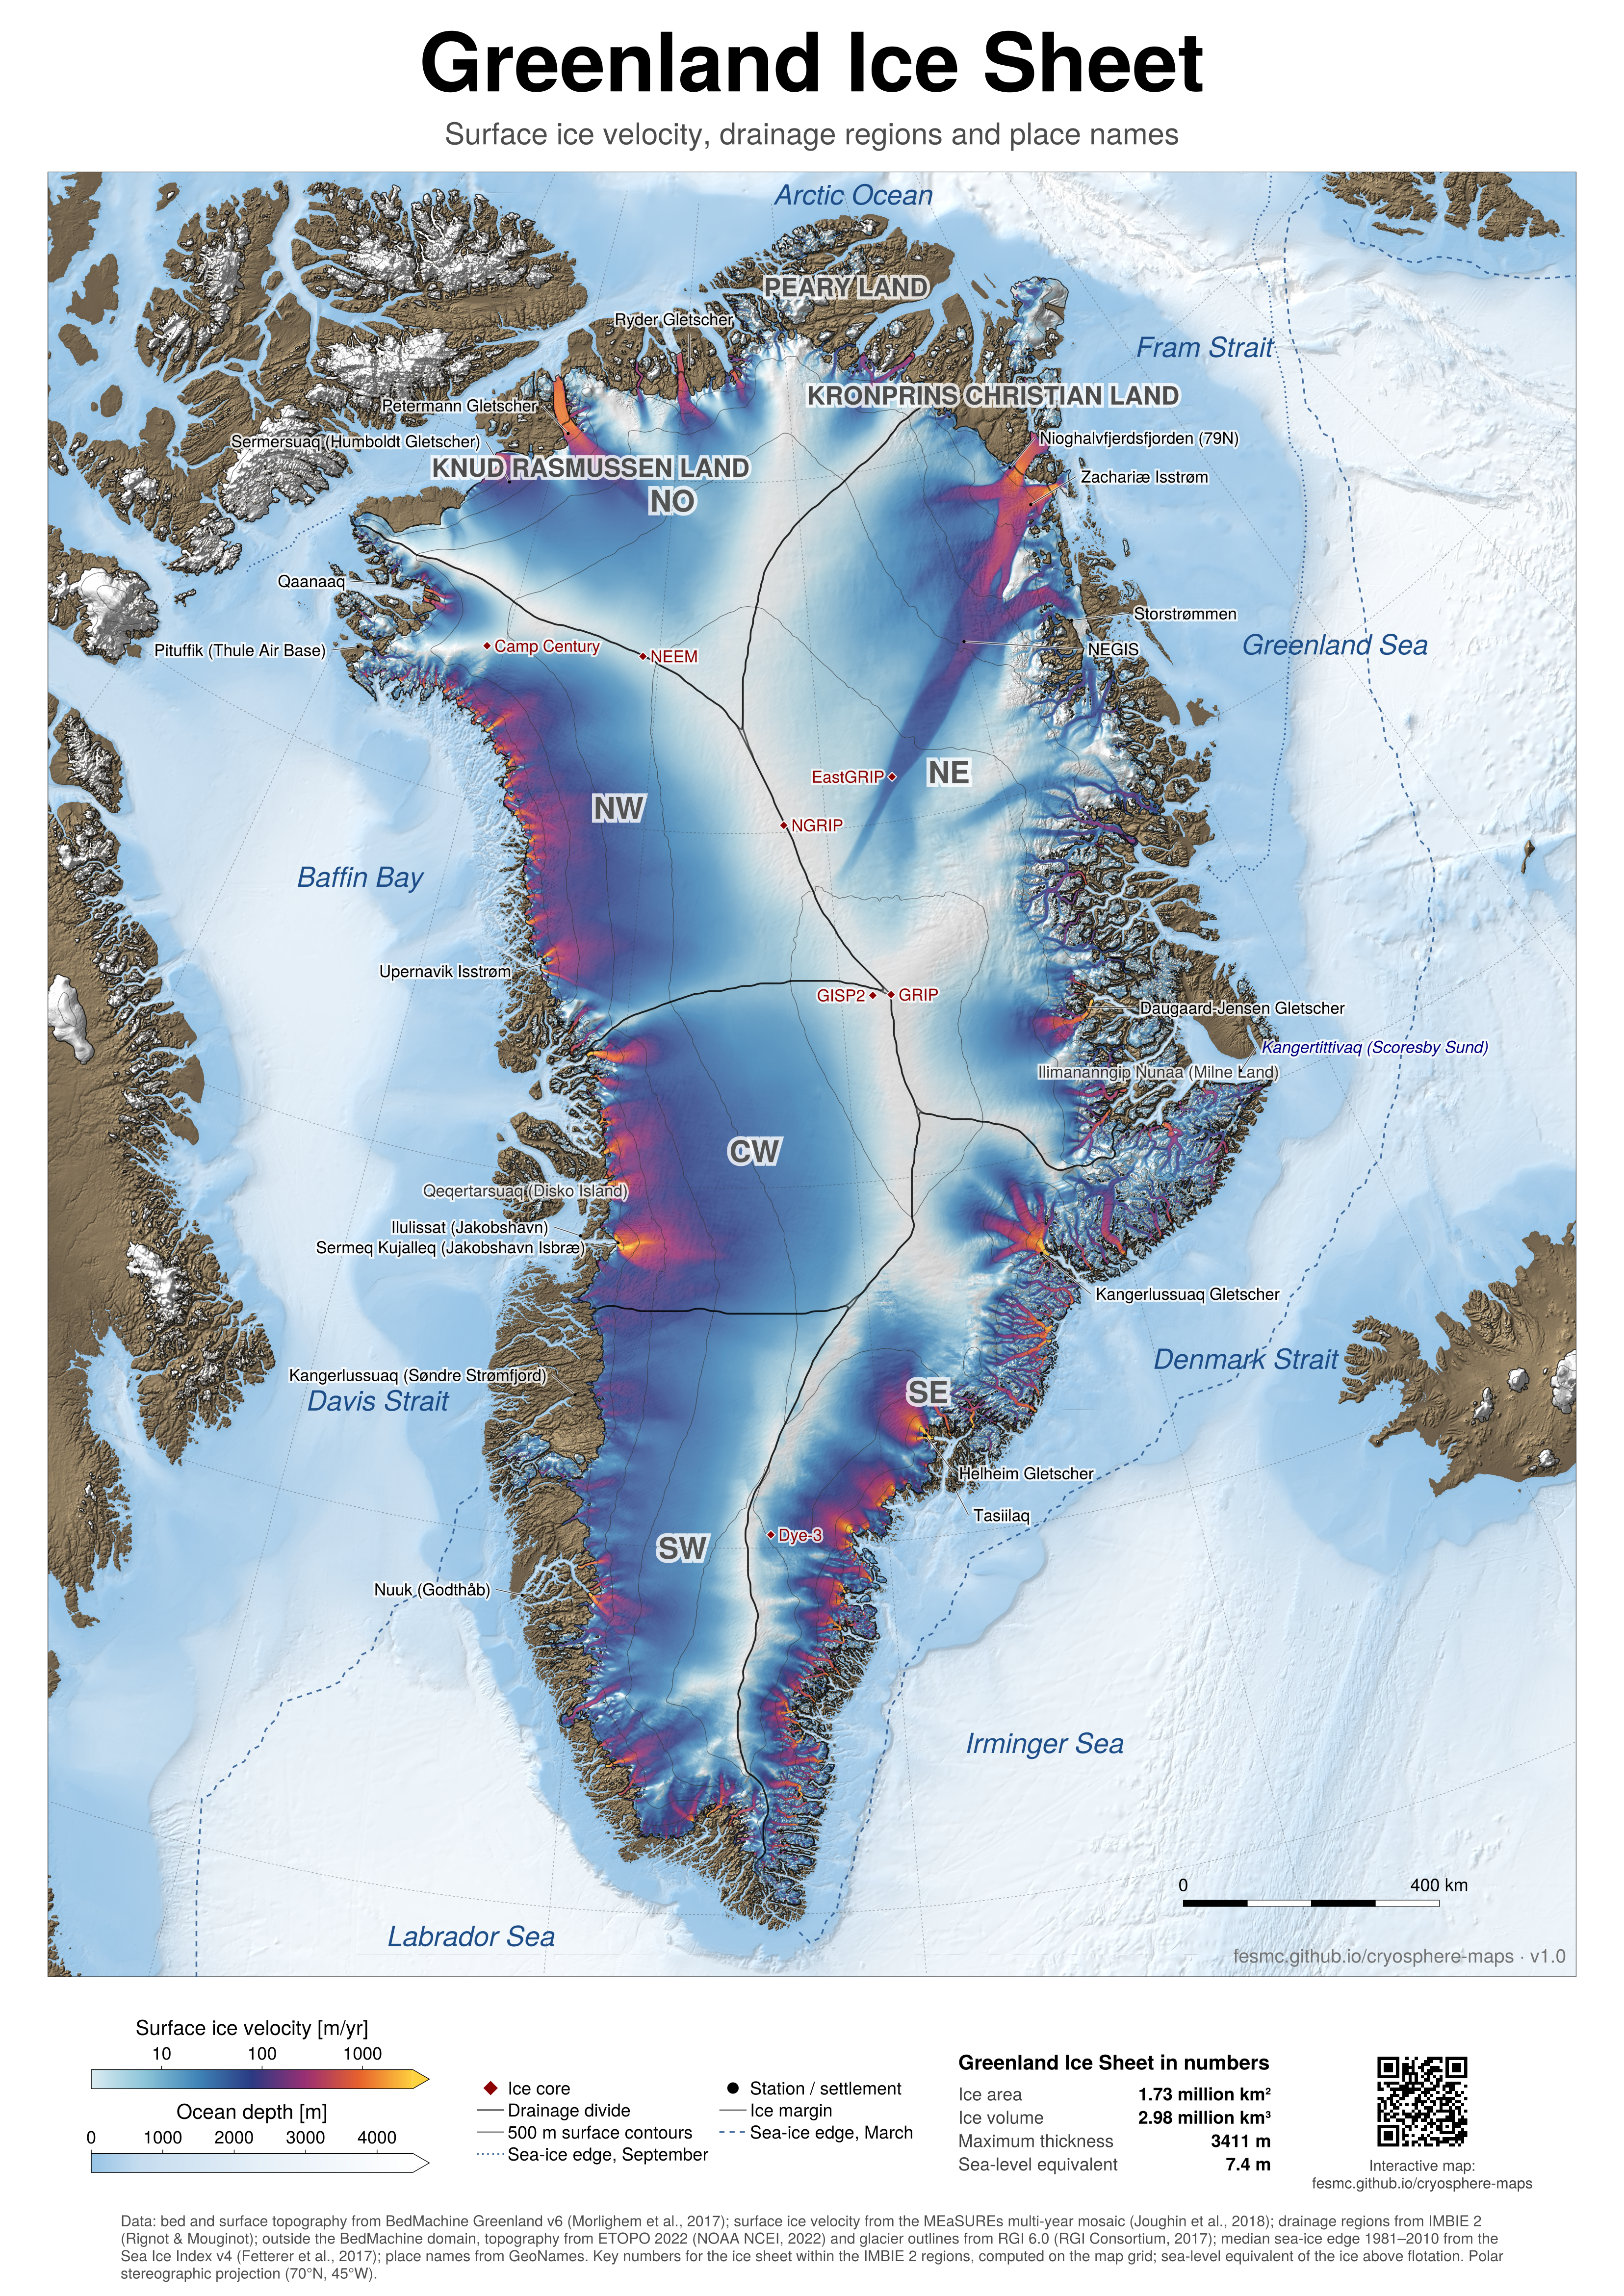
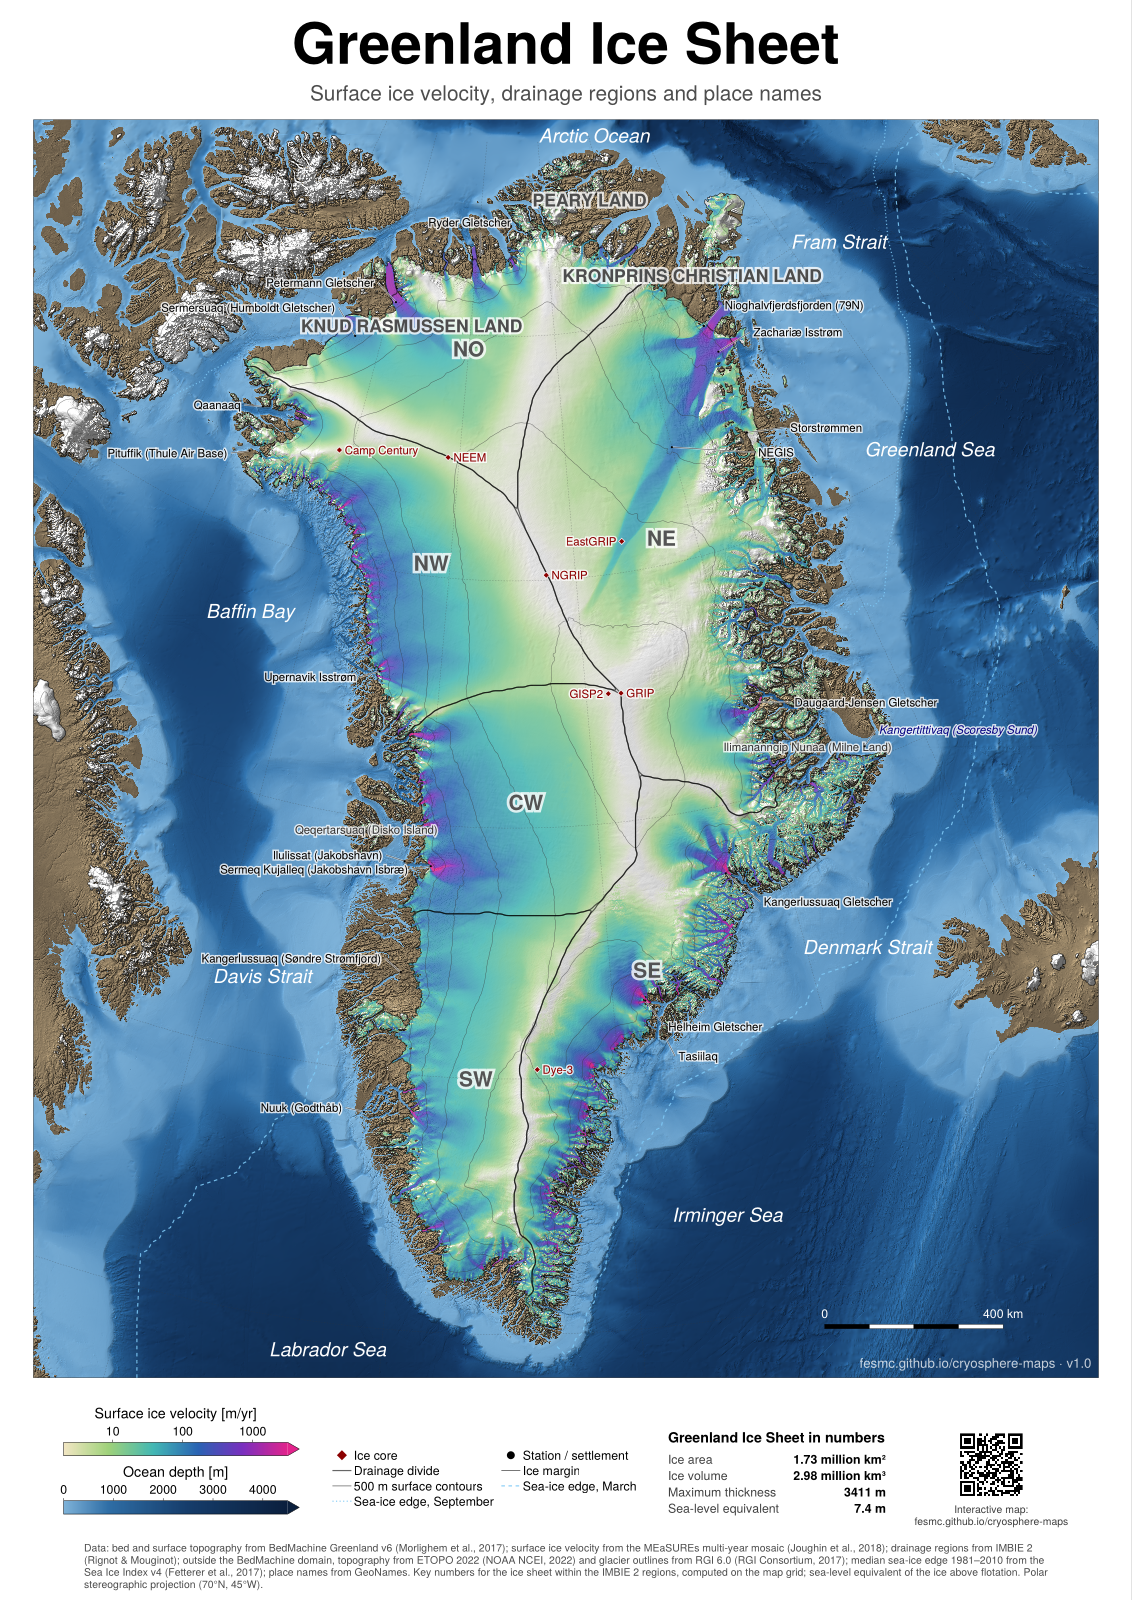
Greenland: ice velocity, dark ocean · PDF, A0, 41 MB · PNG, 100 dpi, 17 MB
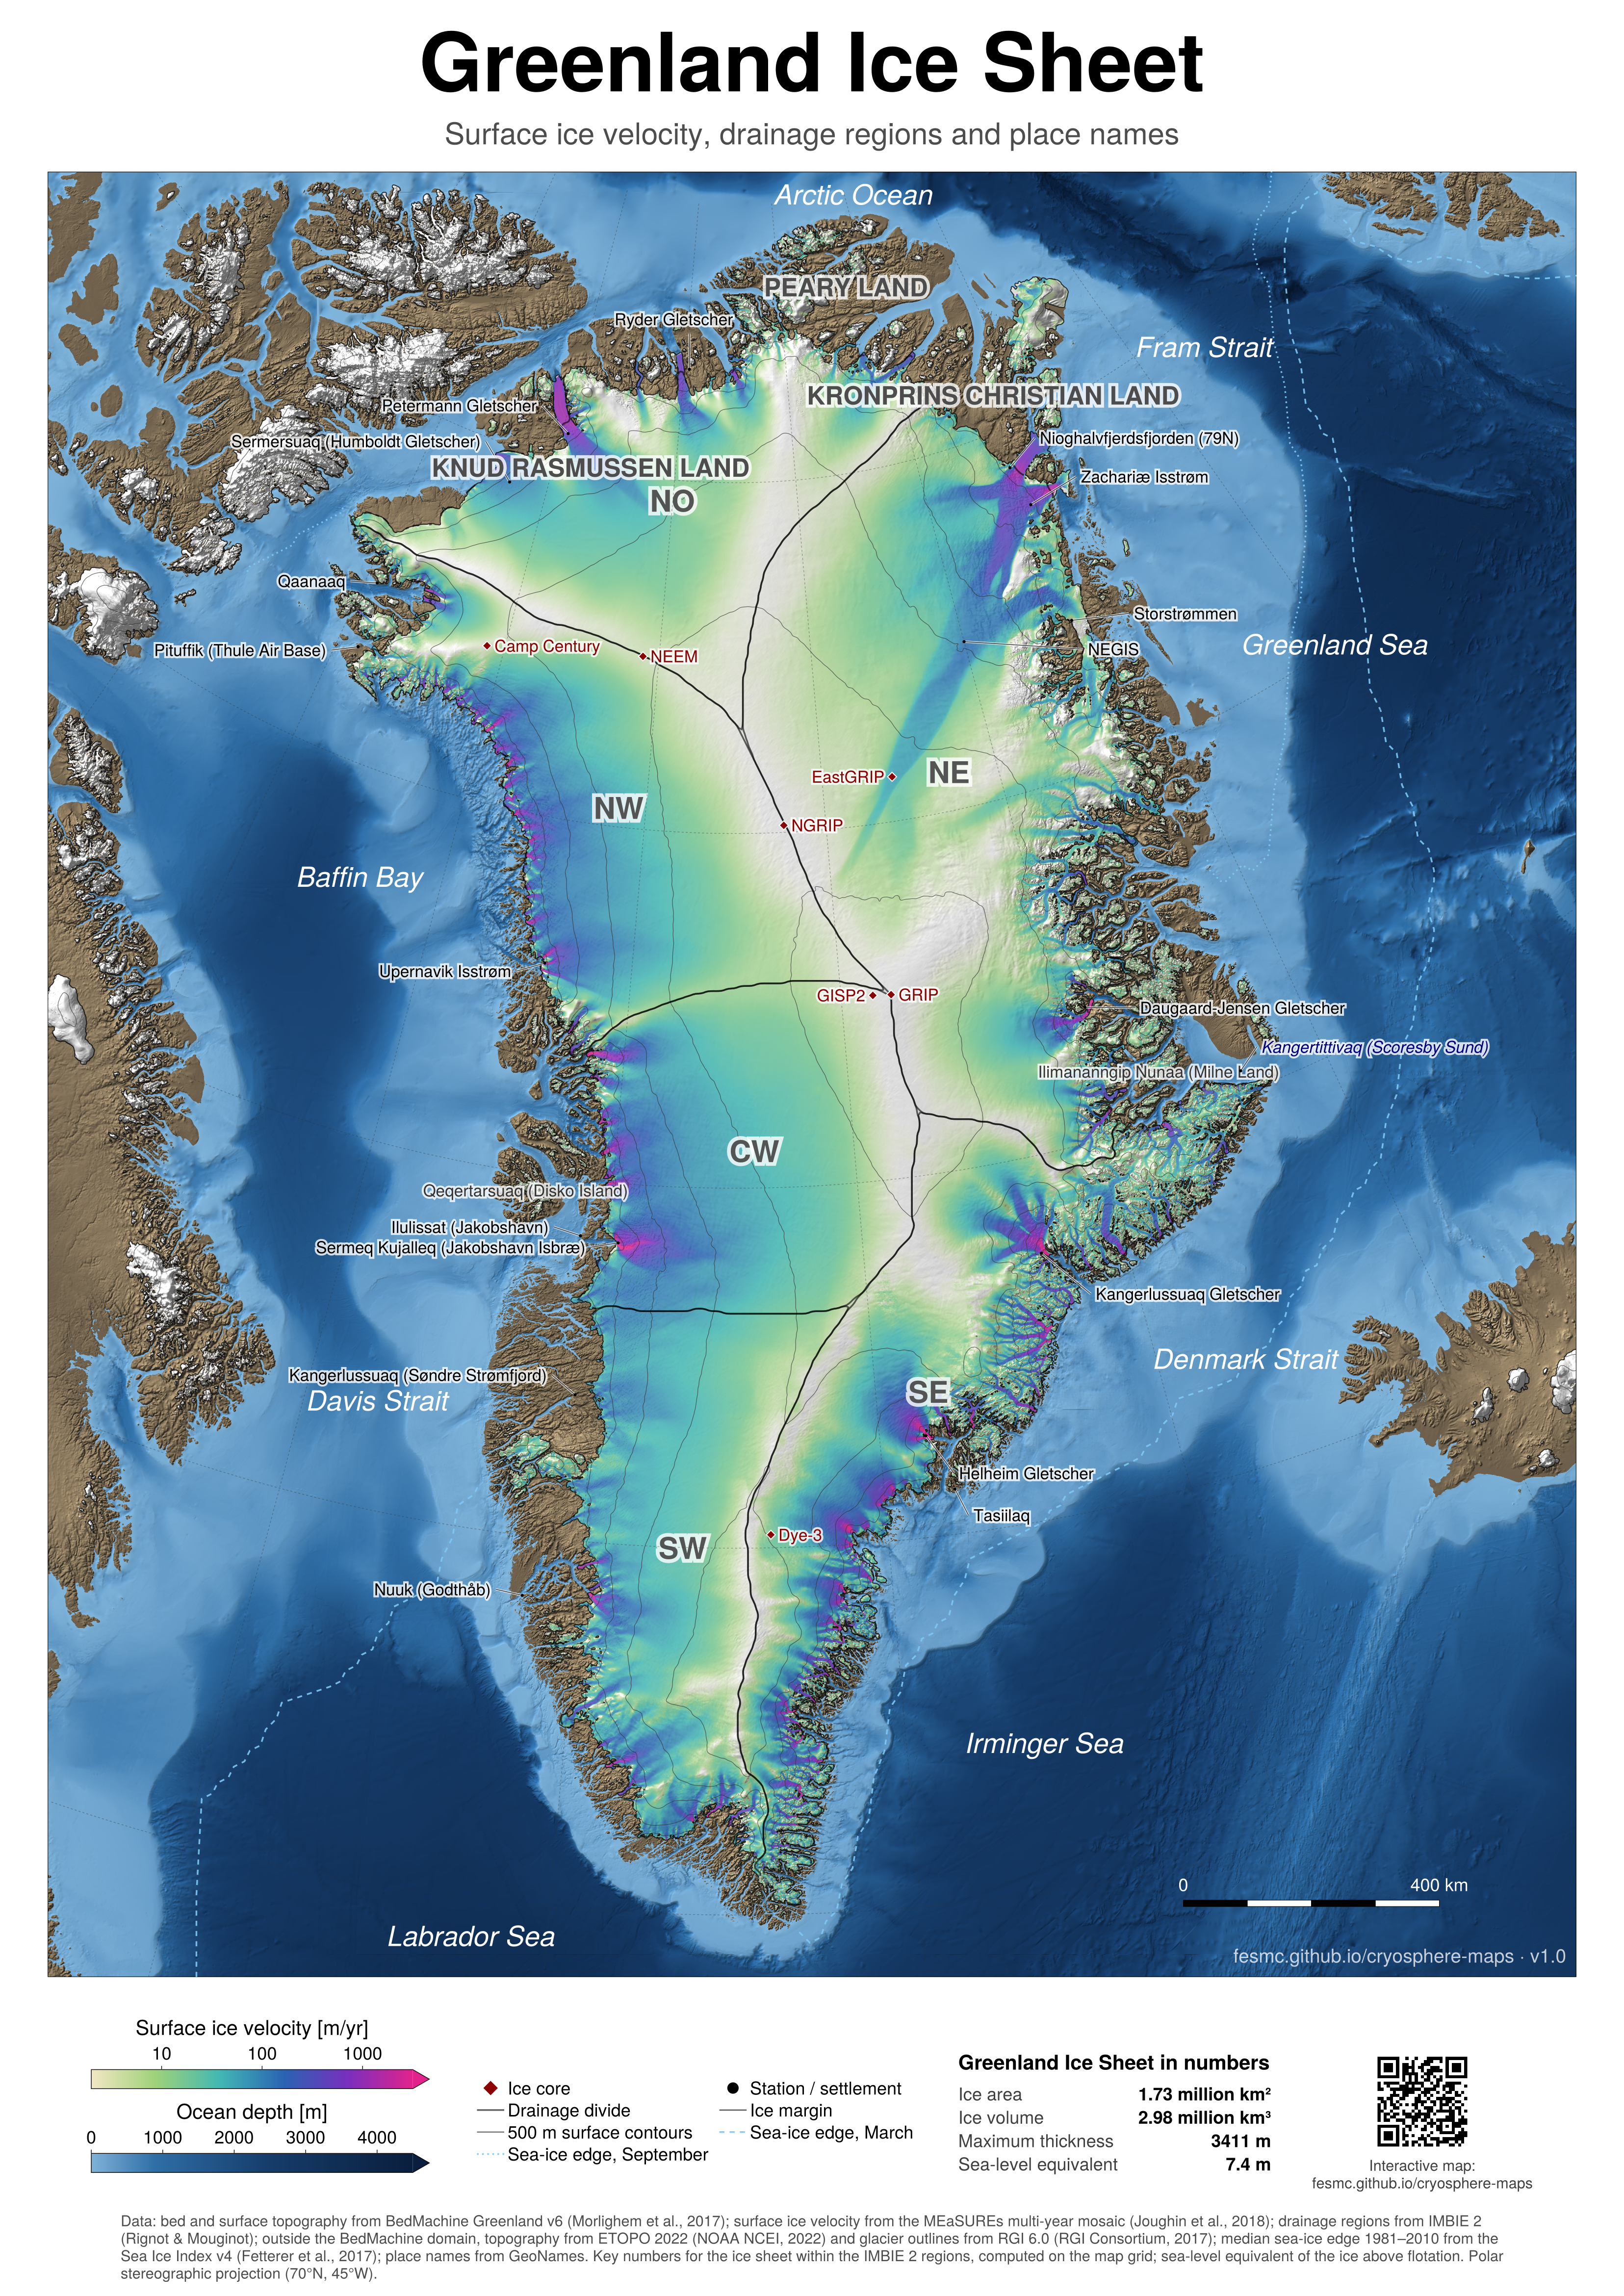
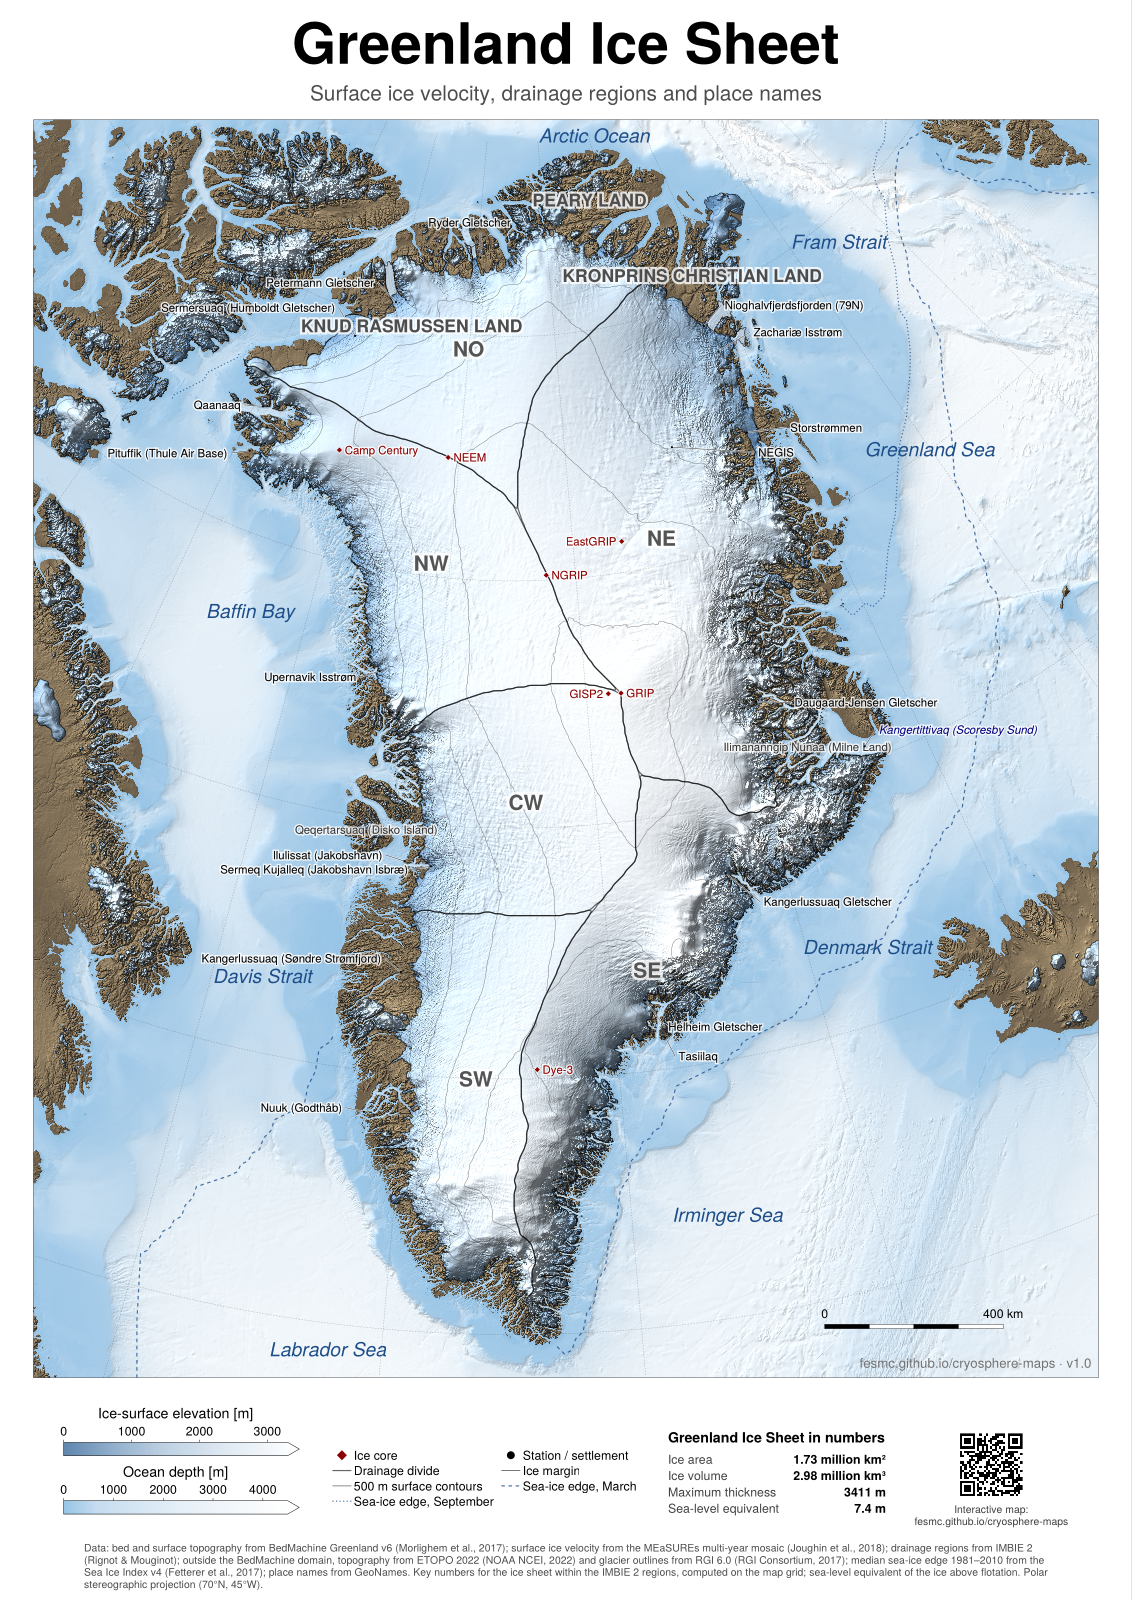
Greenland: surface elevation · PDF, A0, 41 MB · PNG, 100 dpi, 19 MB
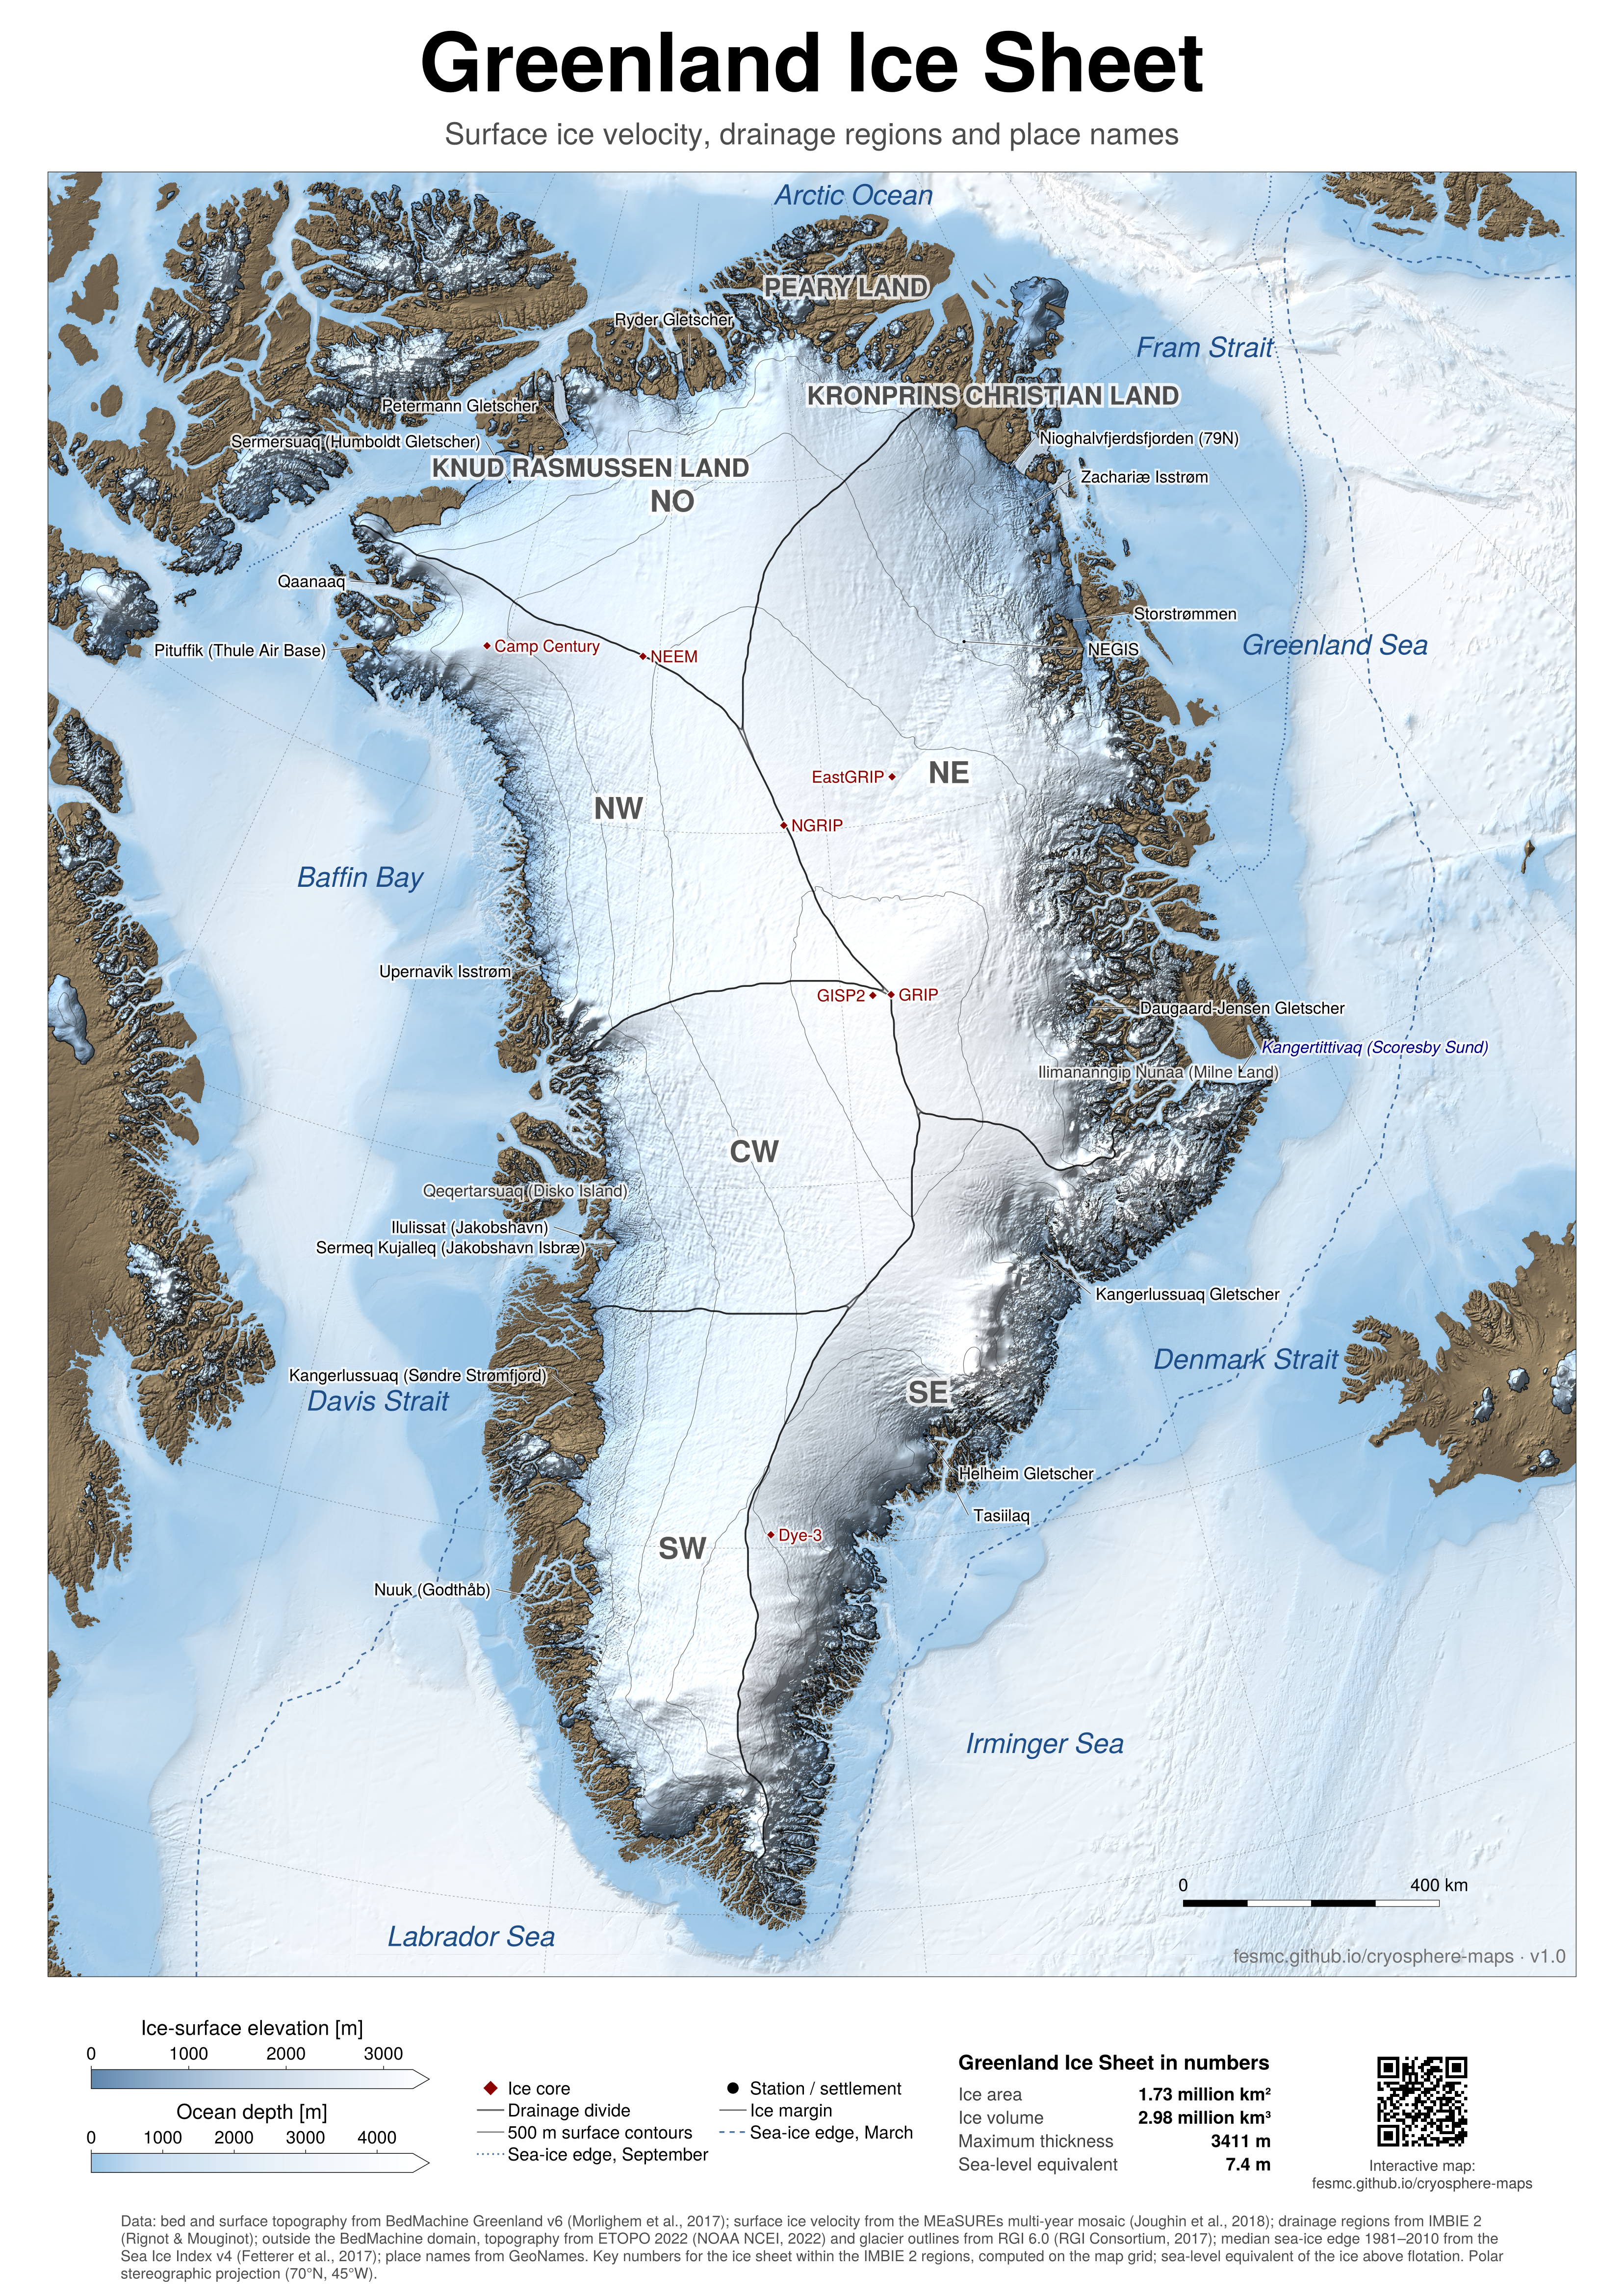
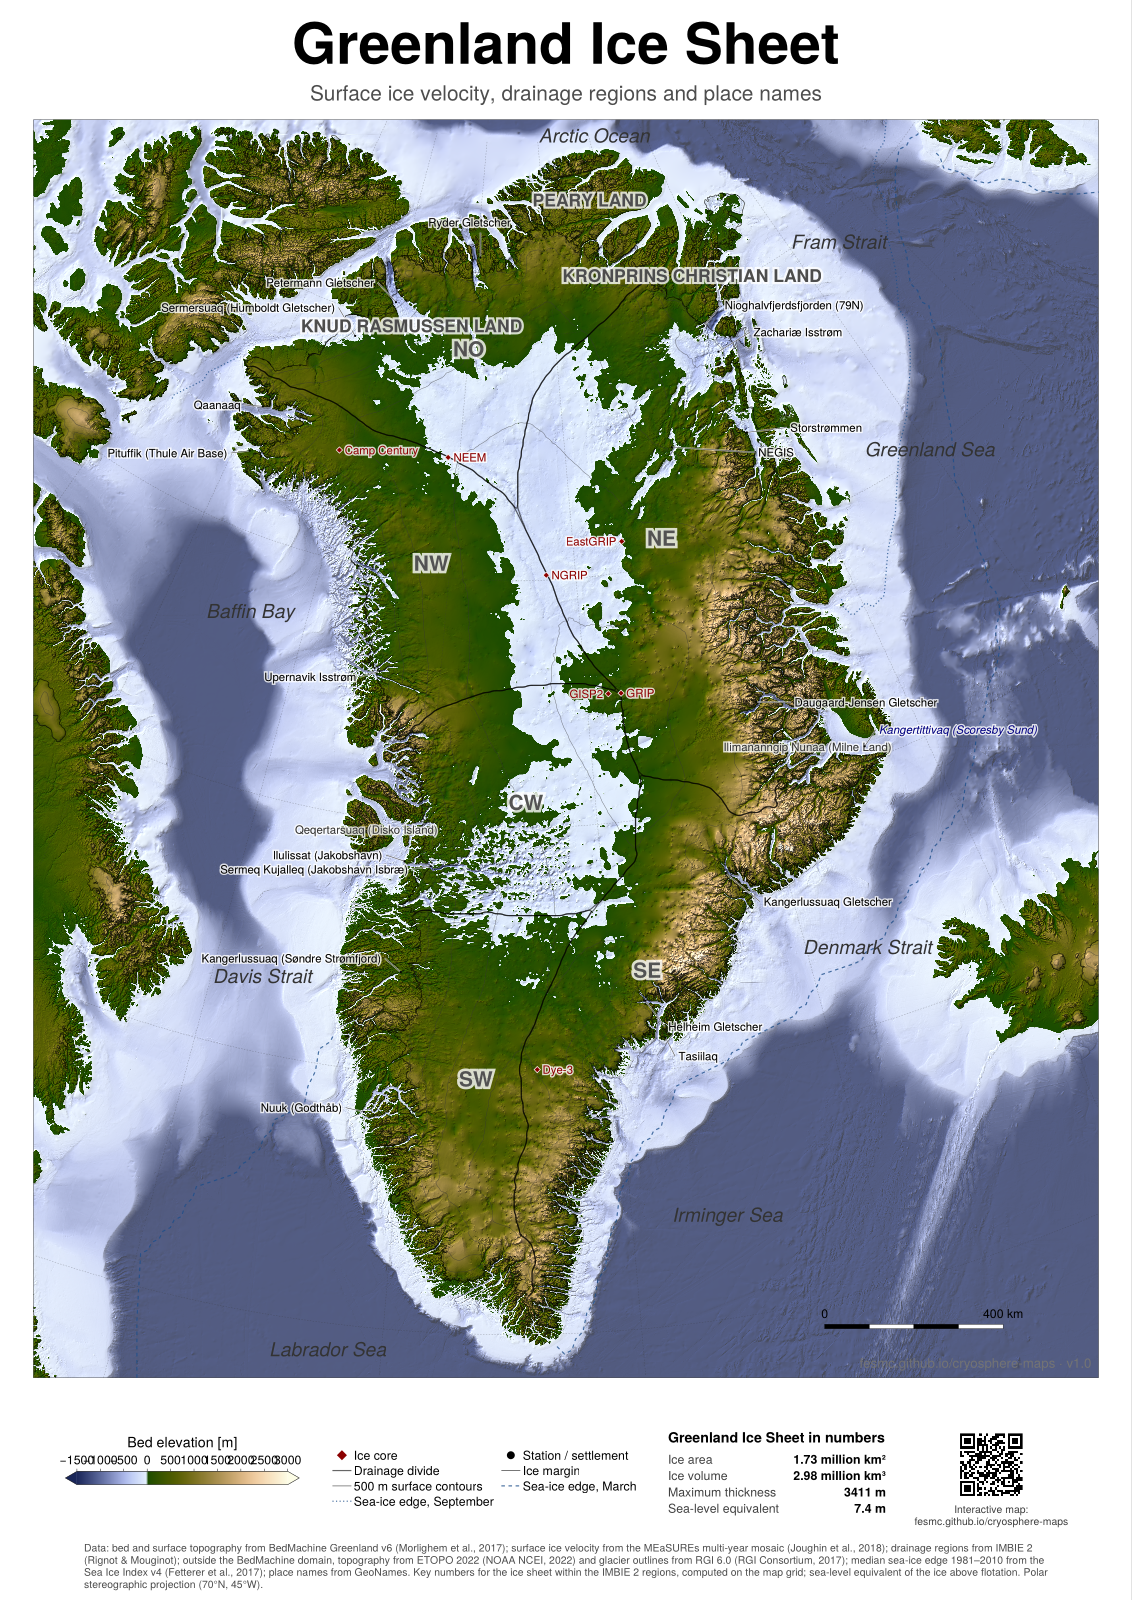
Greenland: bed topography · PDF, A0, 43 MB · PNG, 100 dpi, 17 MB
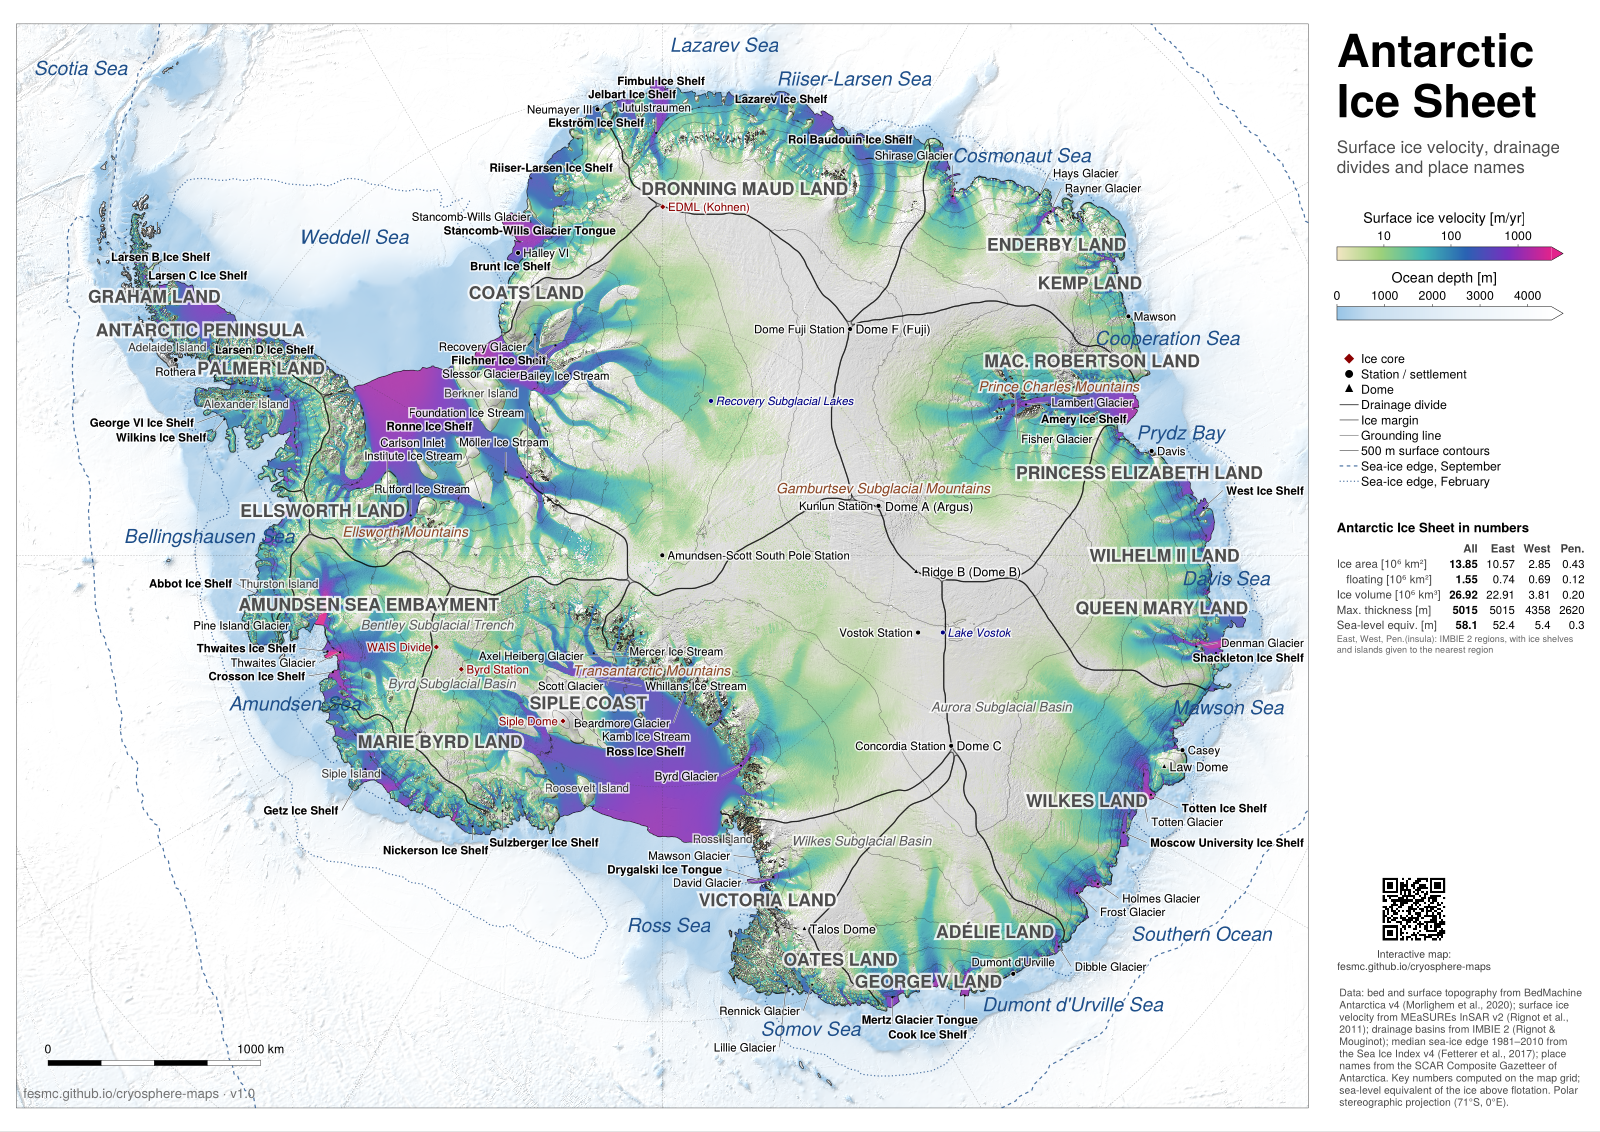
Antarctica: ice velocity, more names · PDF, A0, 44 MB · PNG, 100 dpi, 17 MB
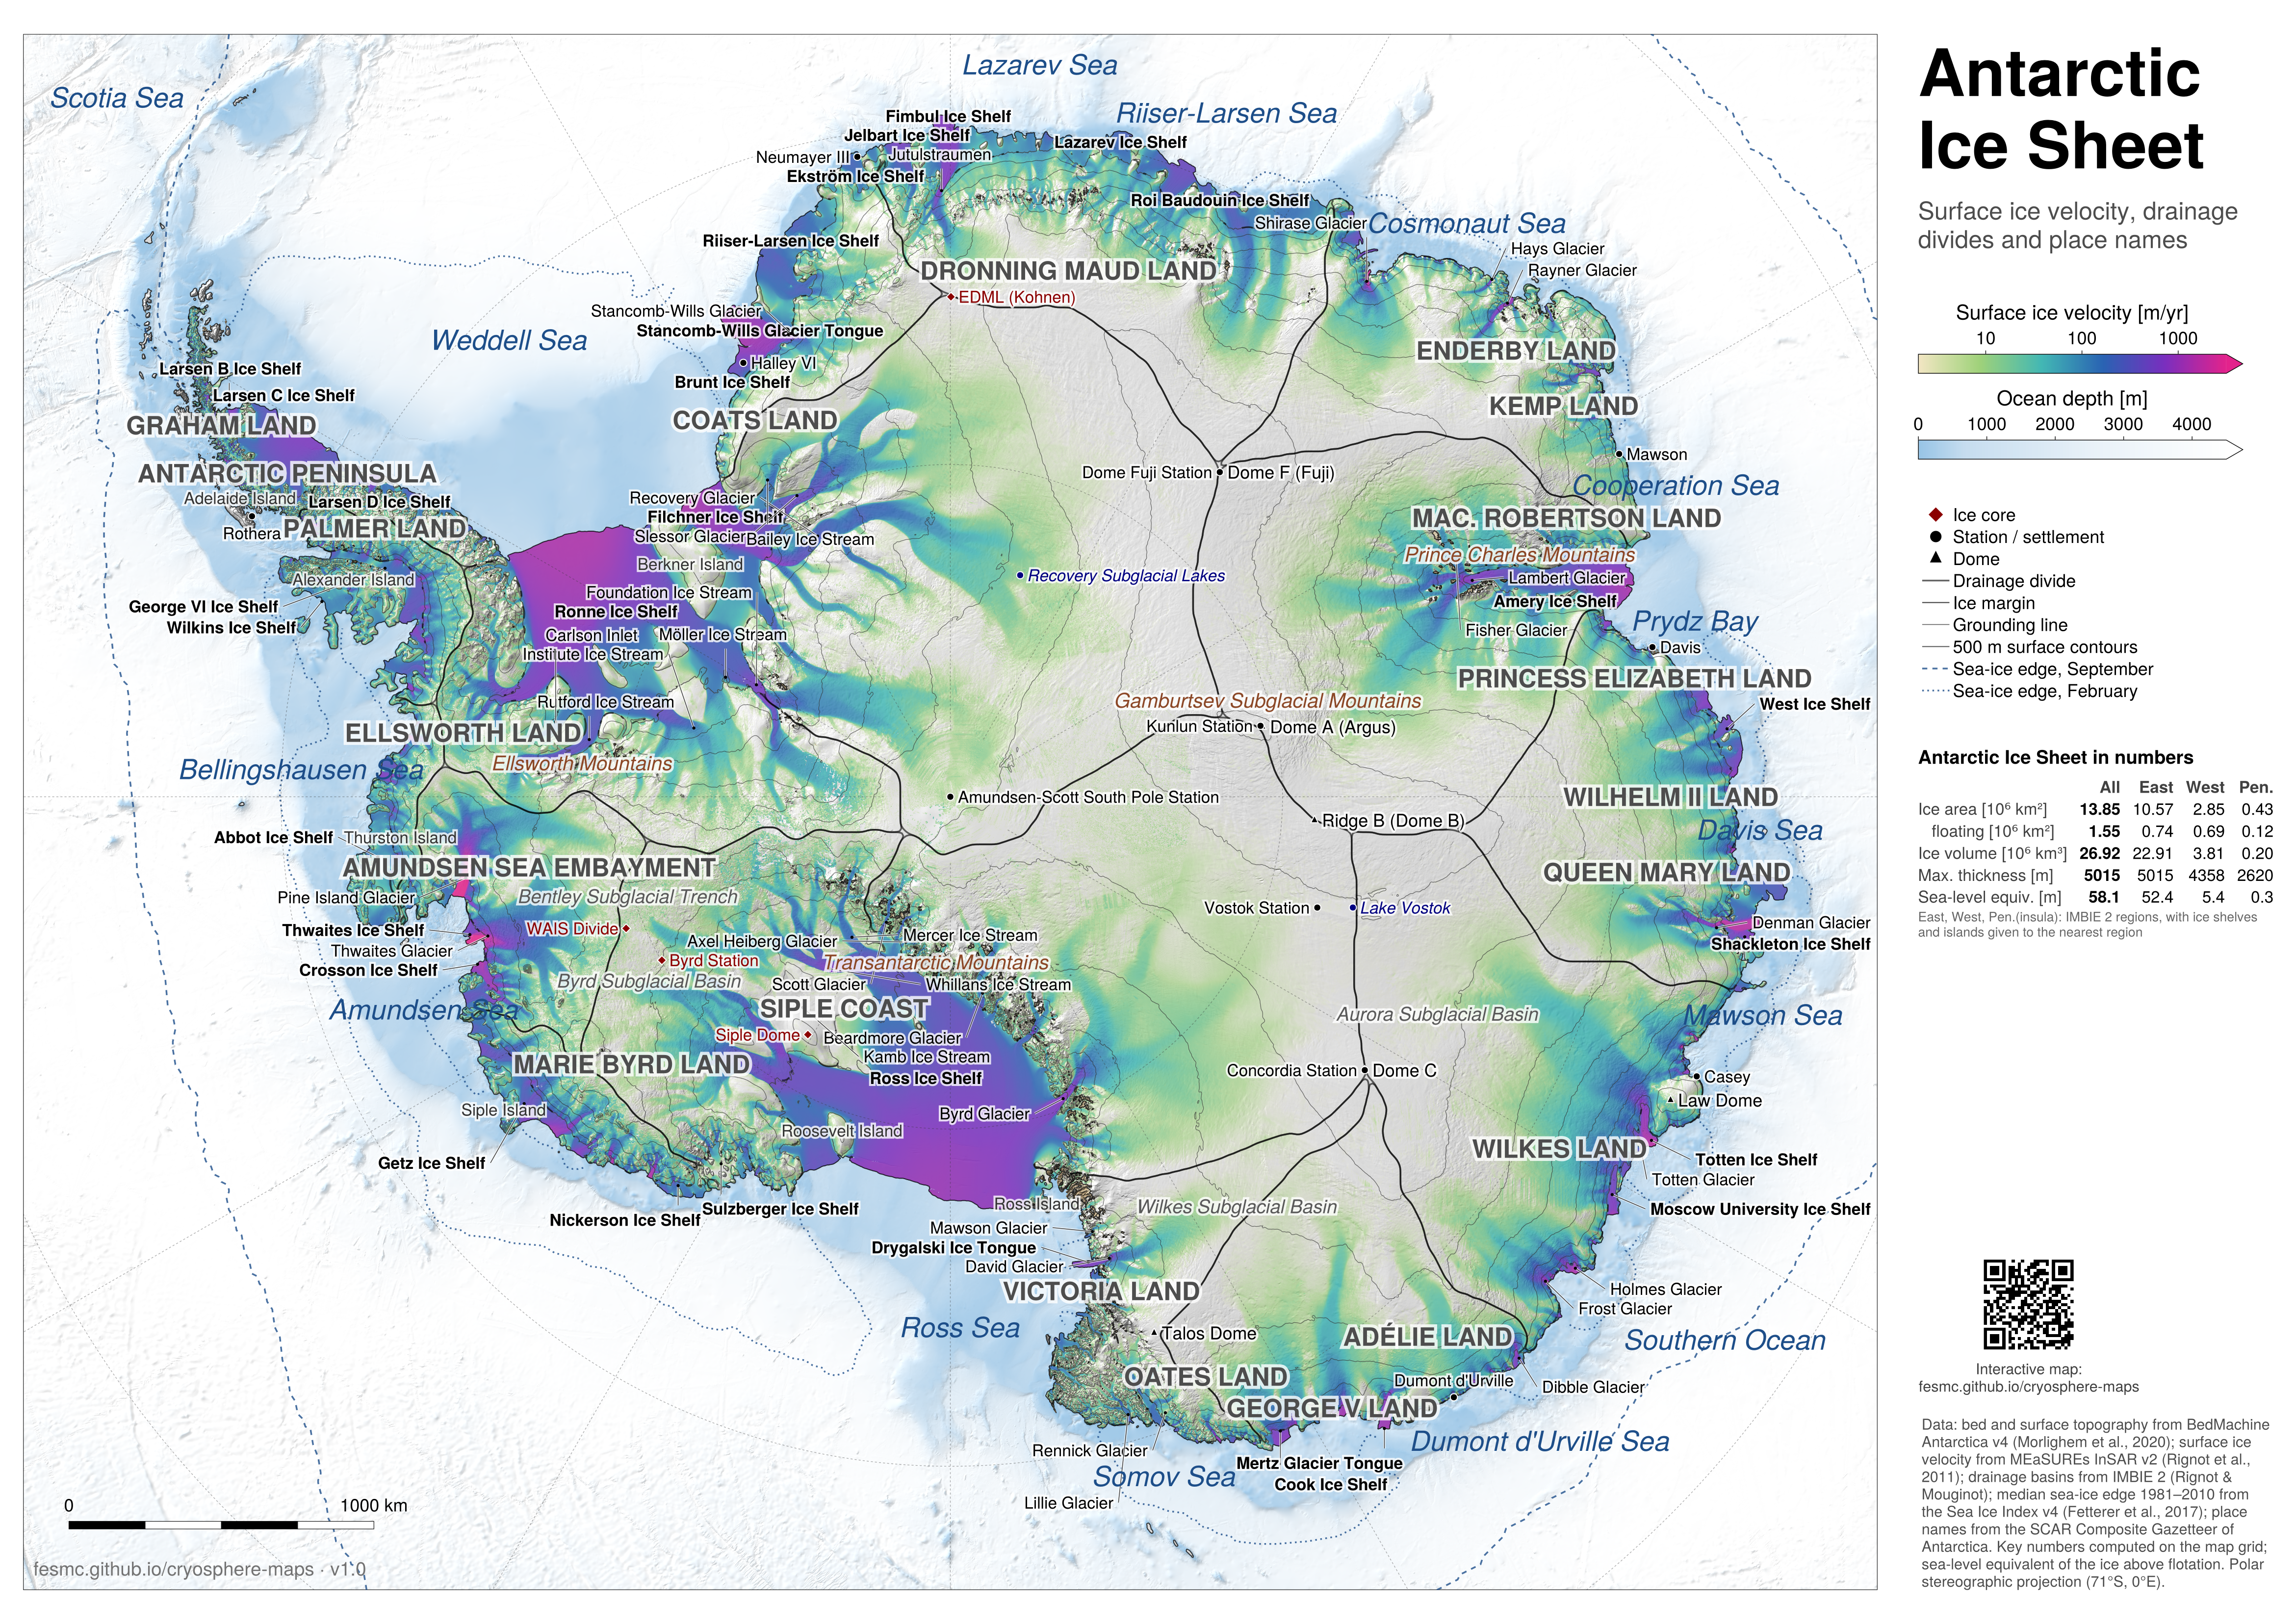
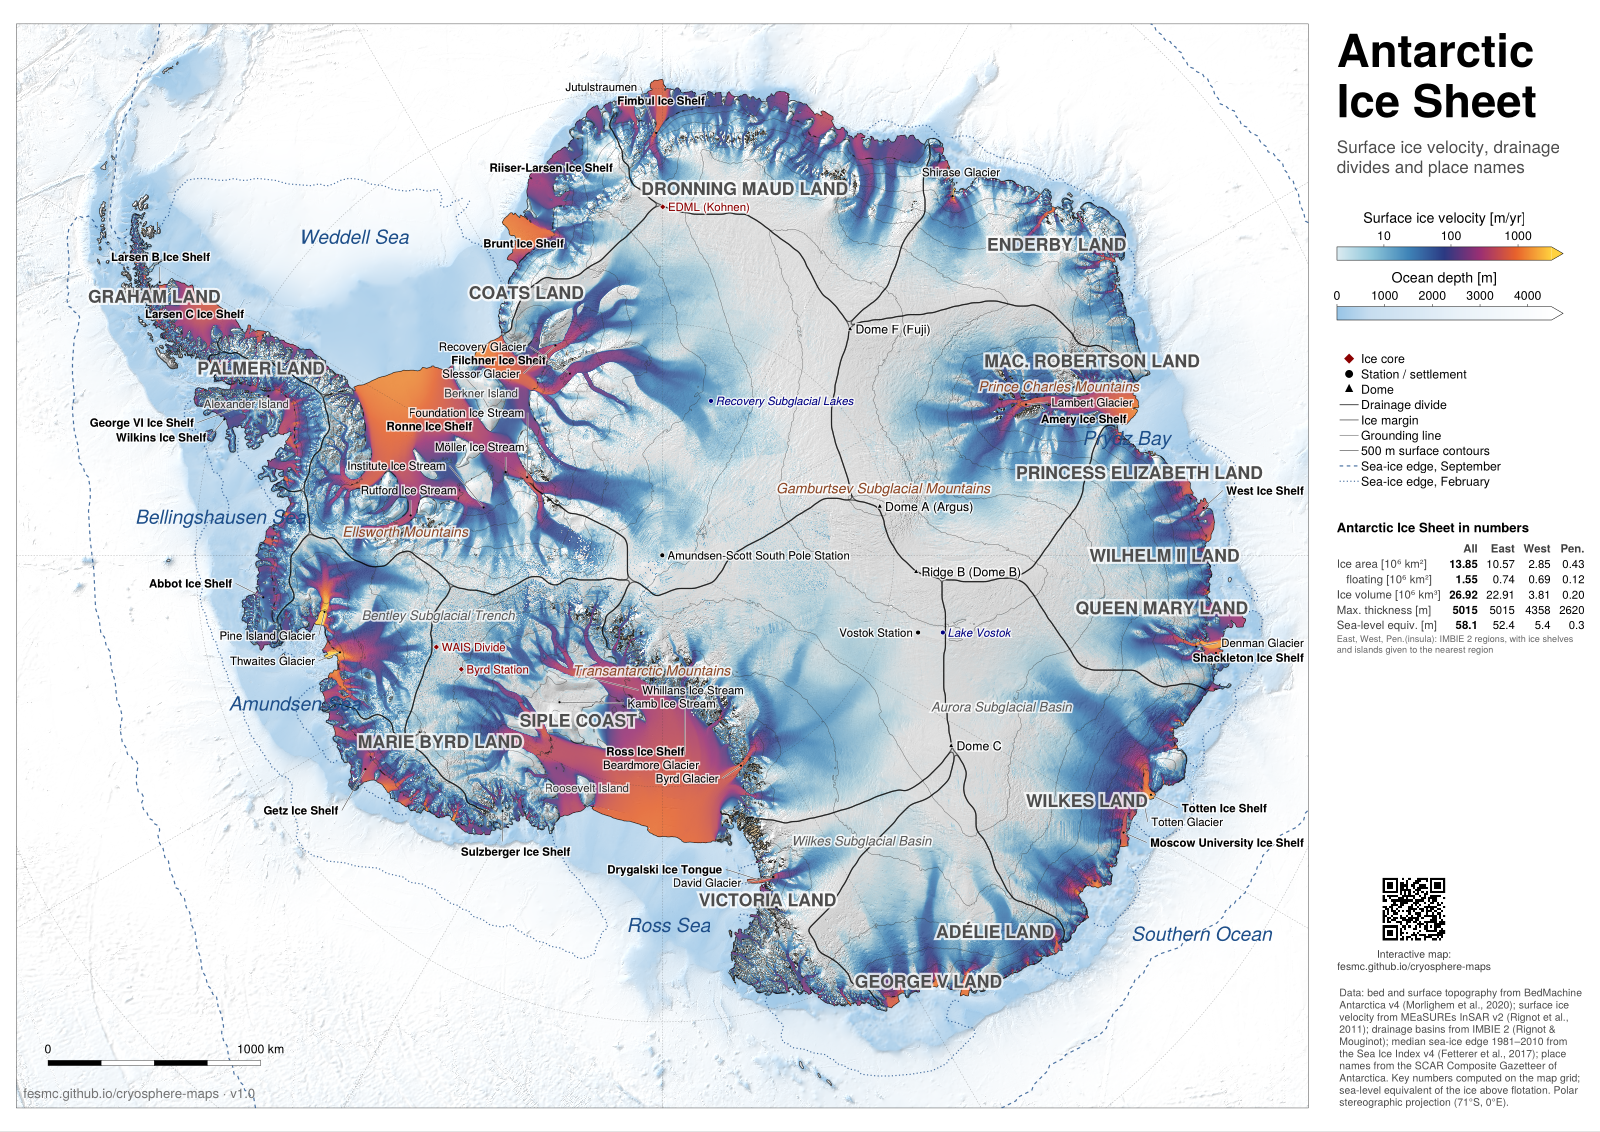
Antarctica: ice velocity, ember colours · PDF, A0, 44 MB · PNG, 100 dpi, 17 MB
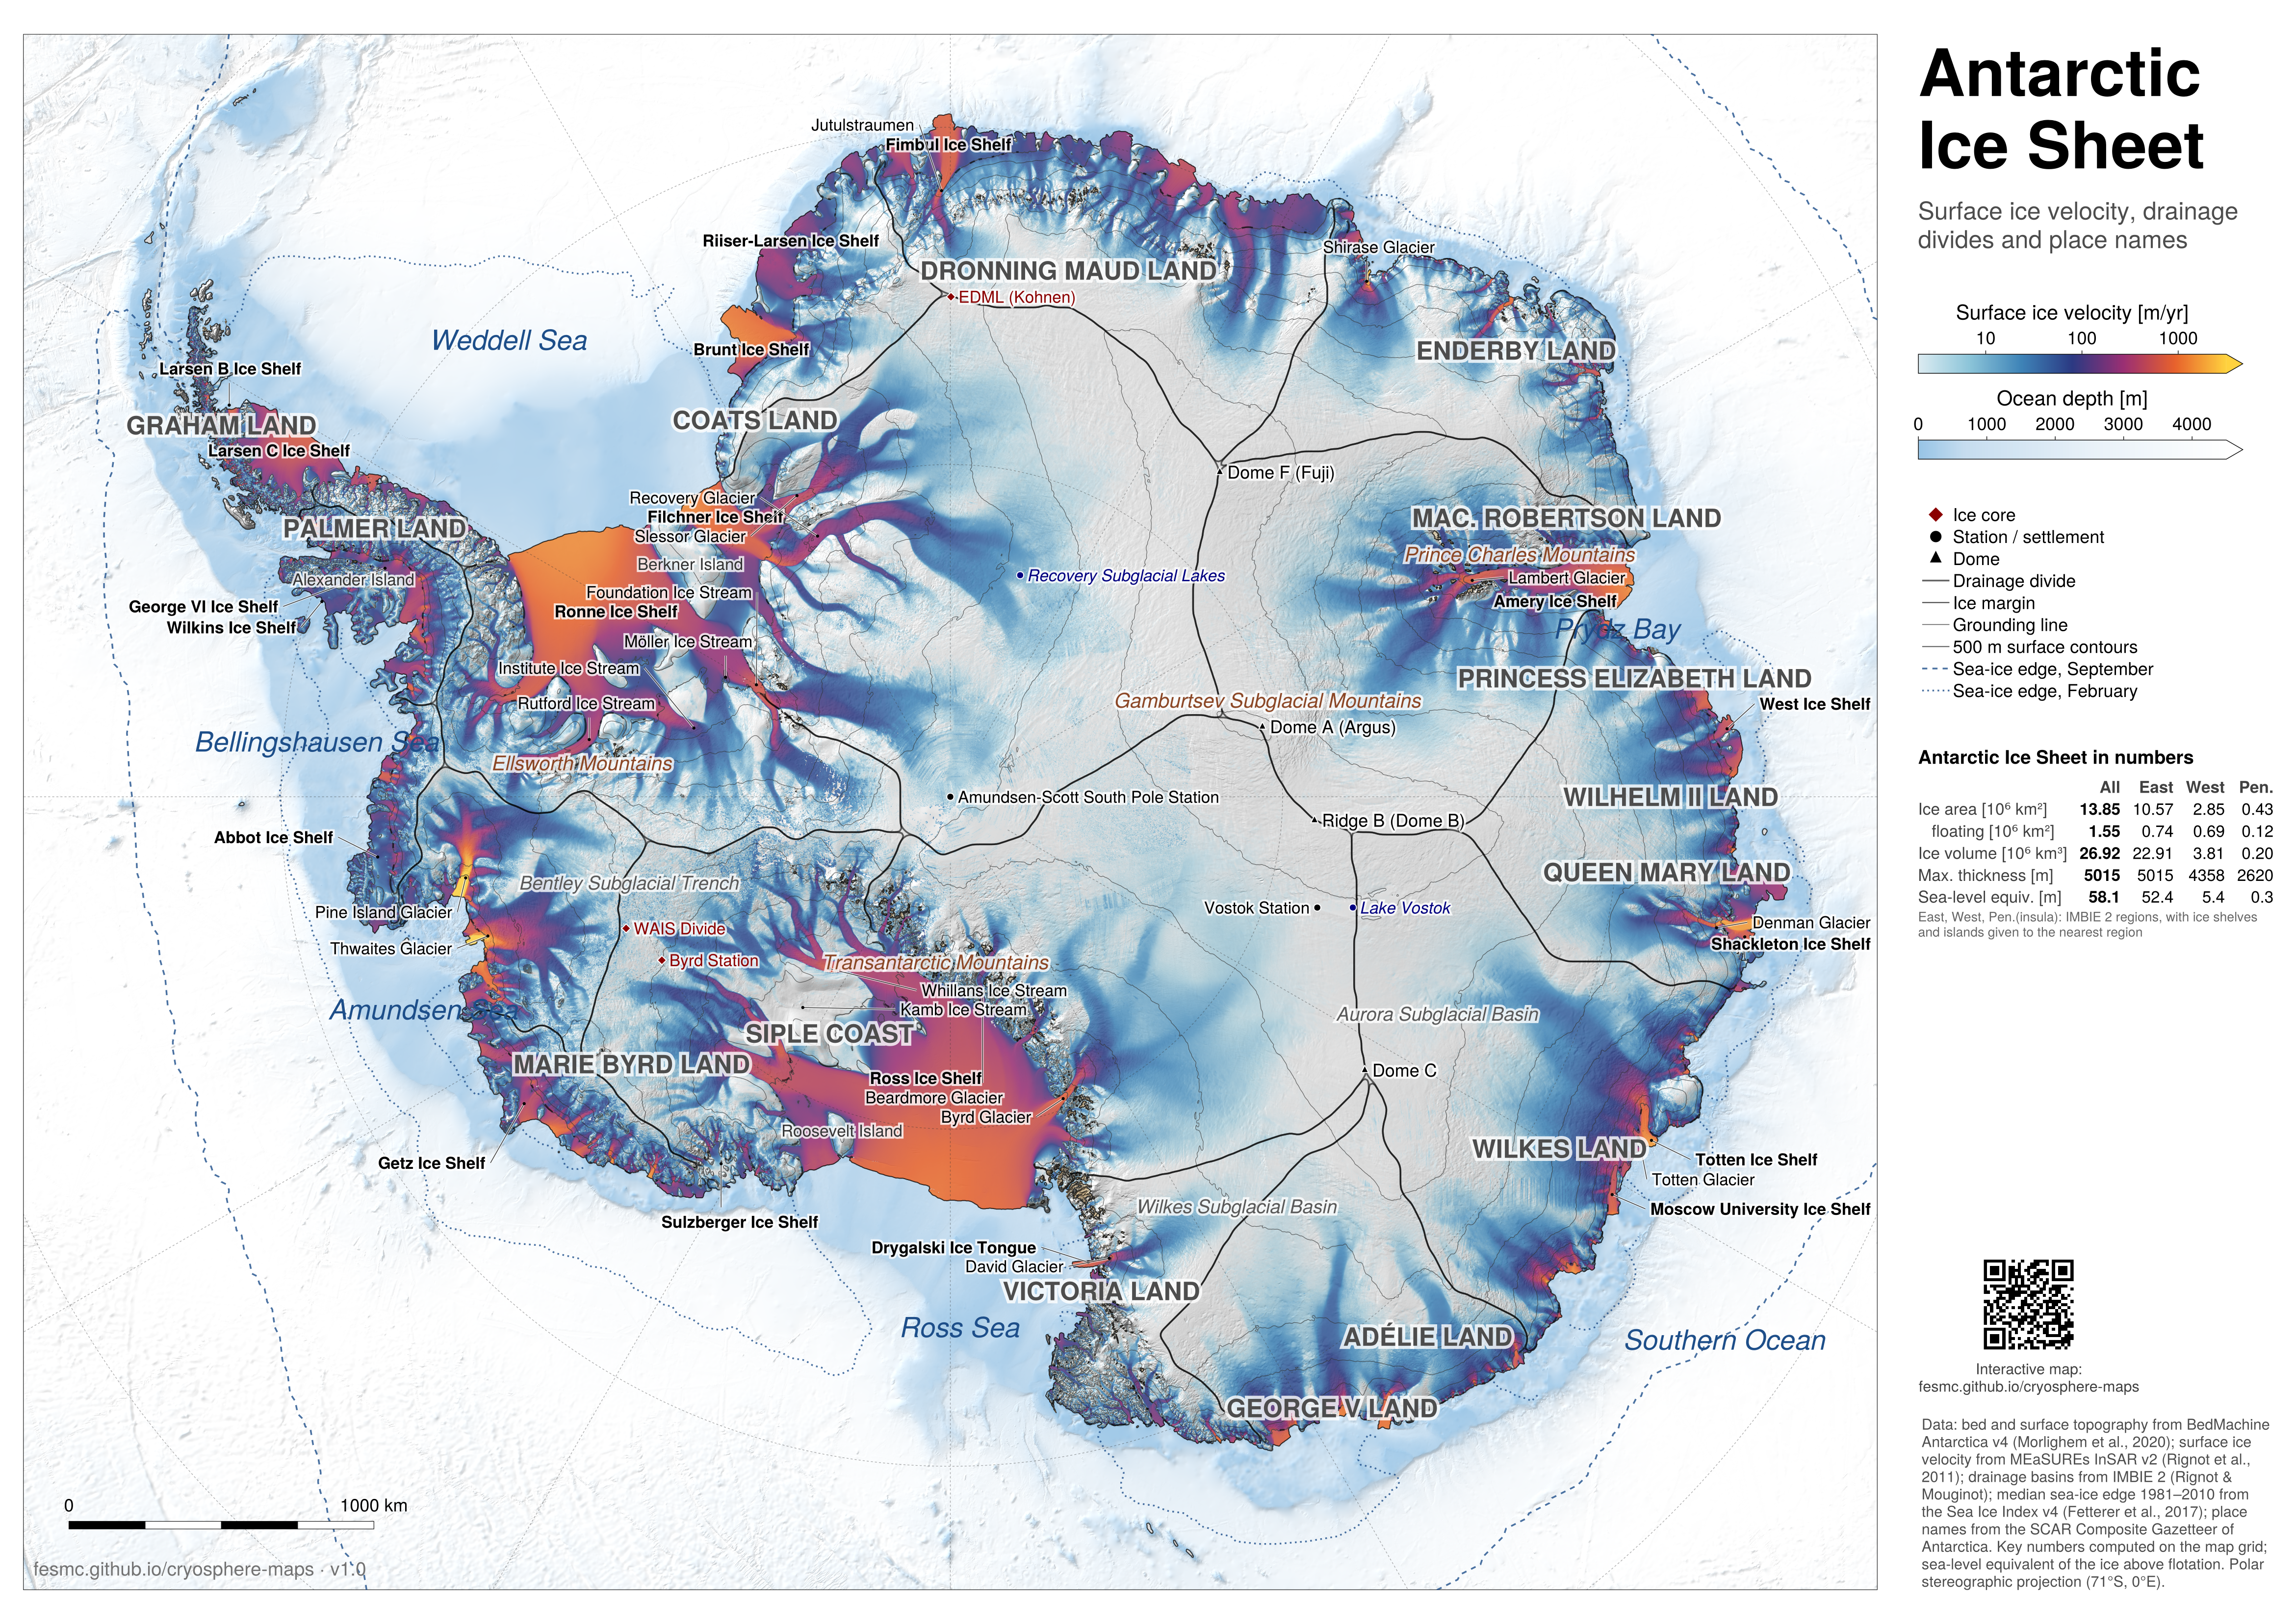
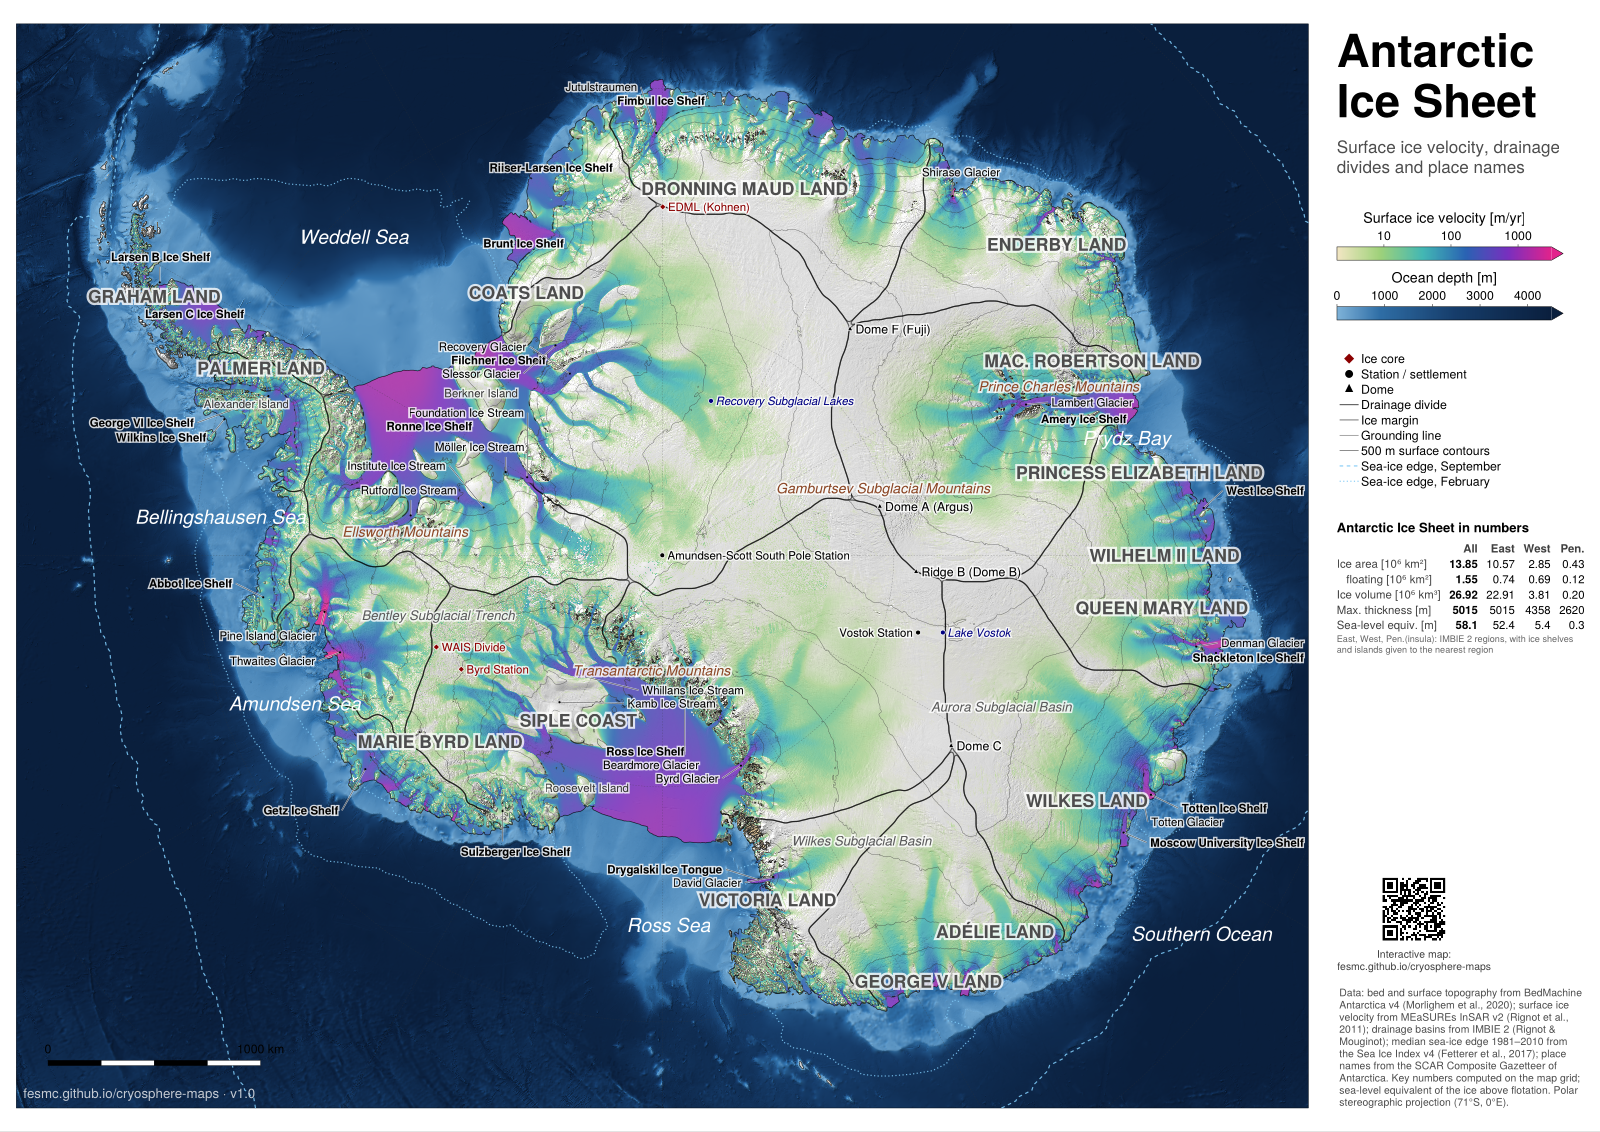
Antarctica: ice velocity, dark ocean · PDF, A0, 43 MB · PNG, 100 dpi, 16 MB
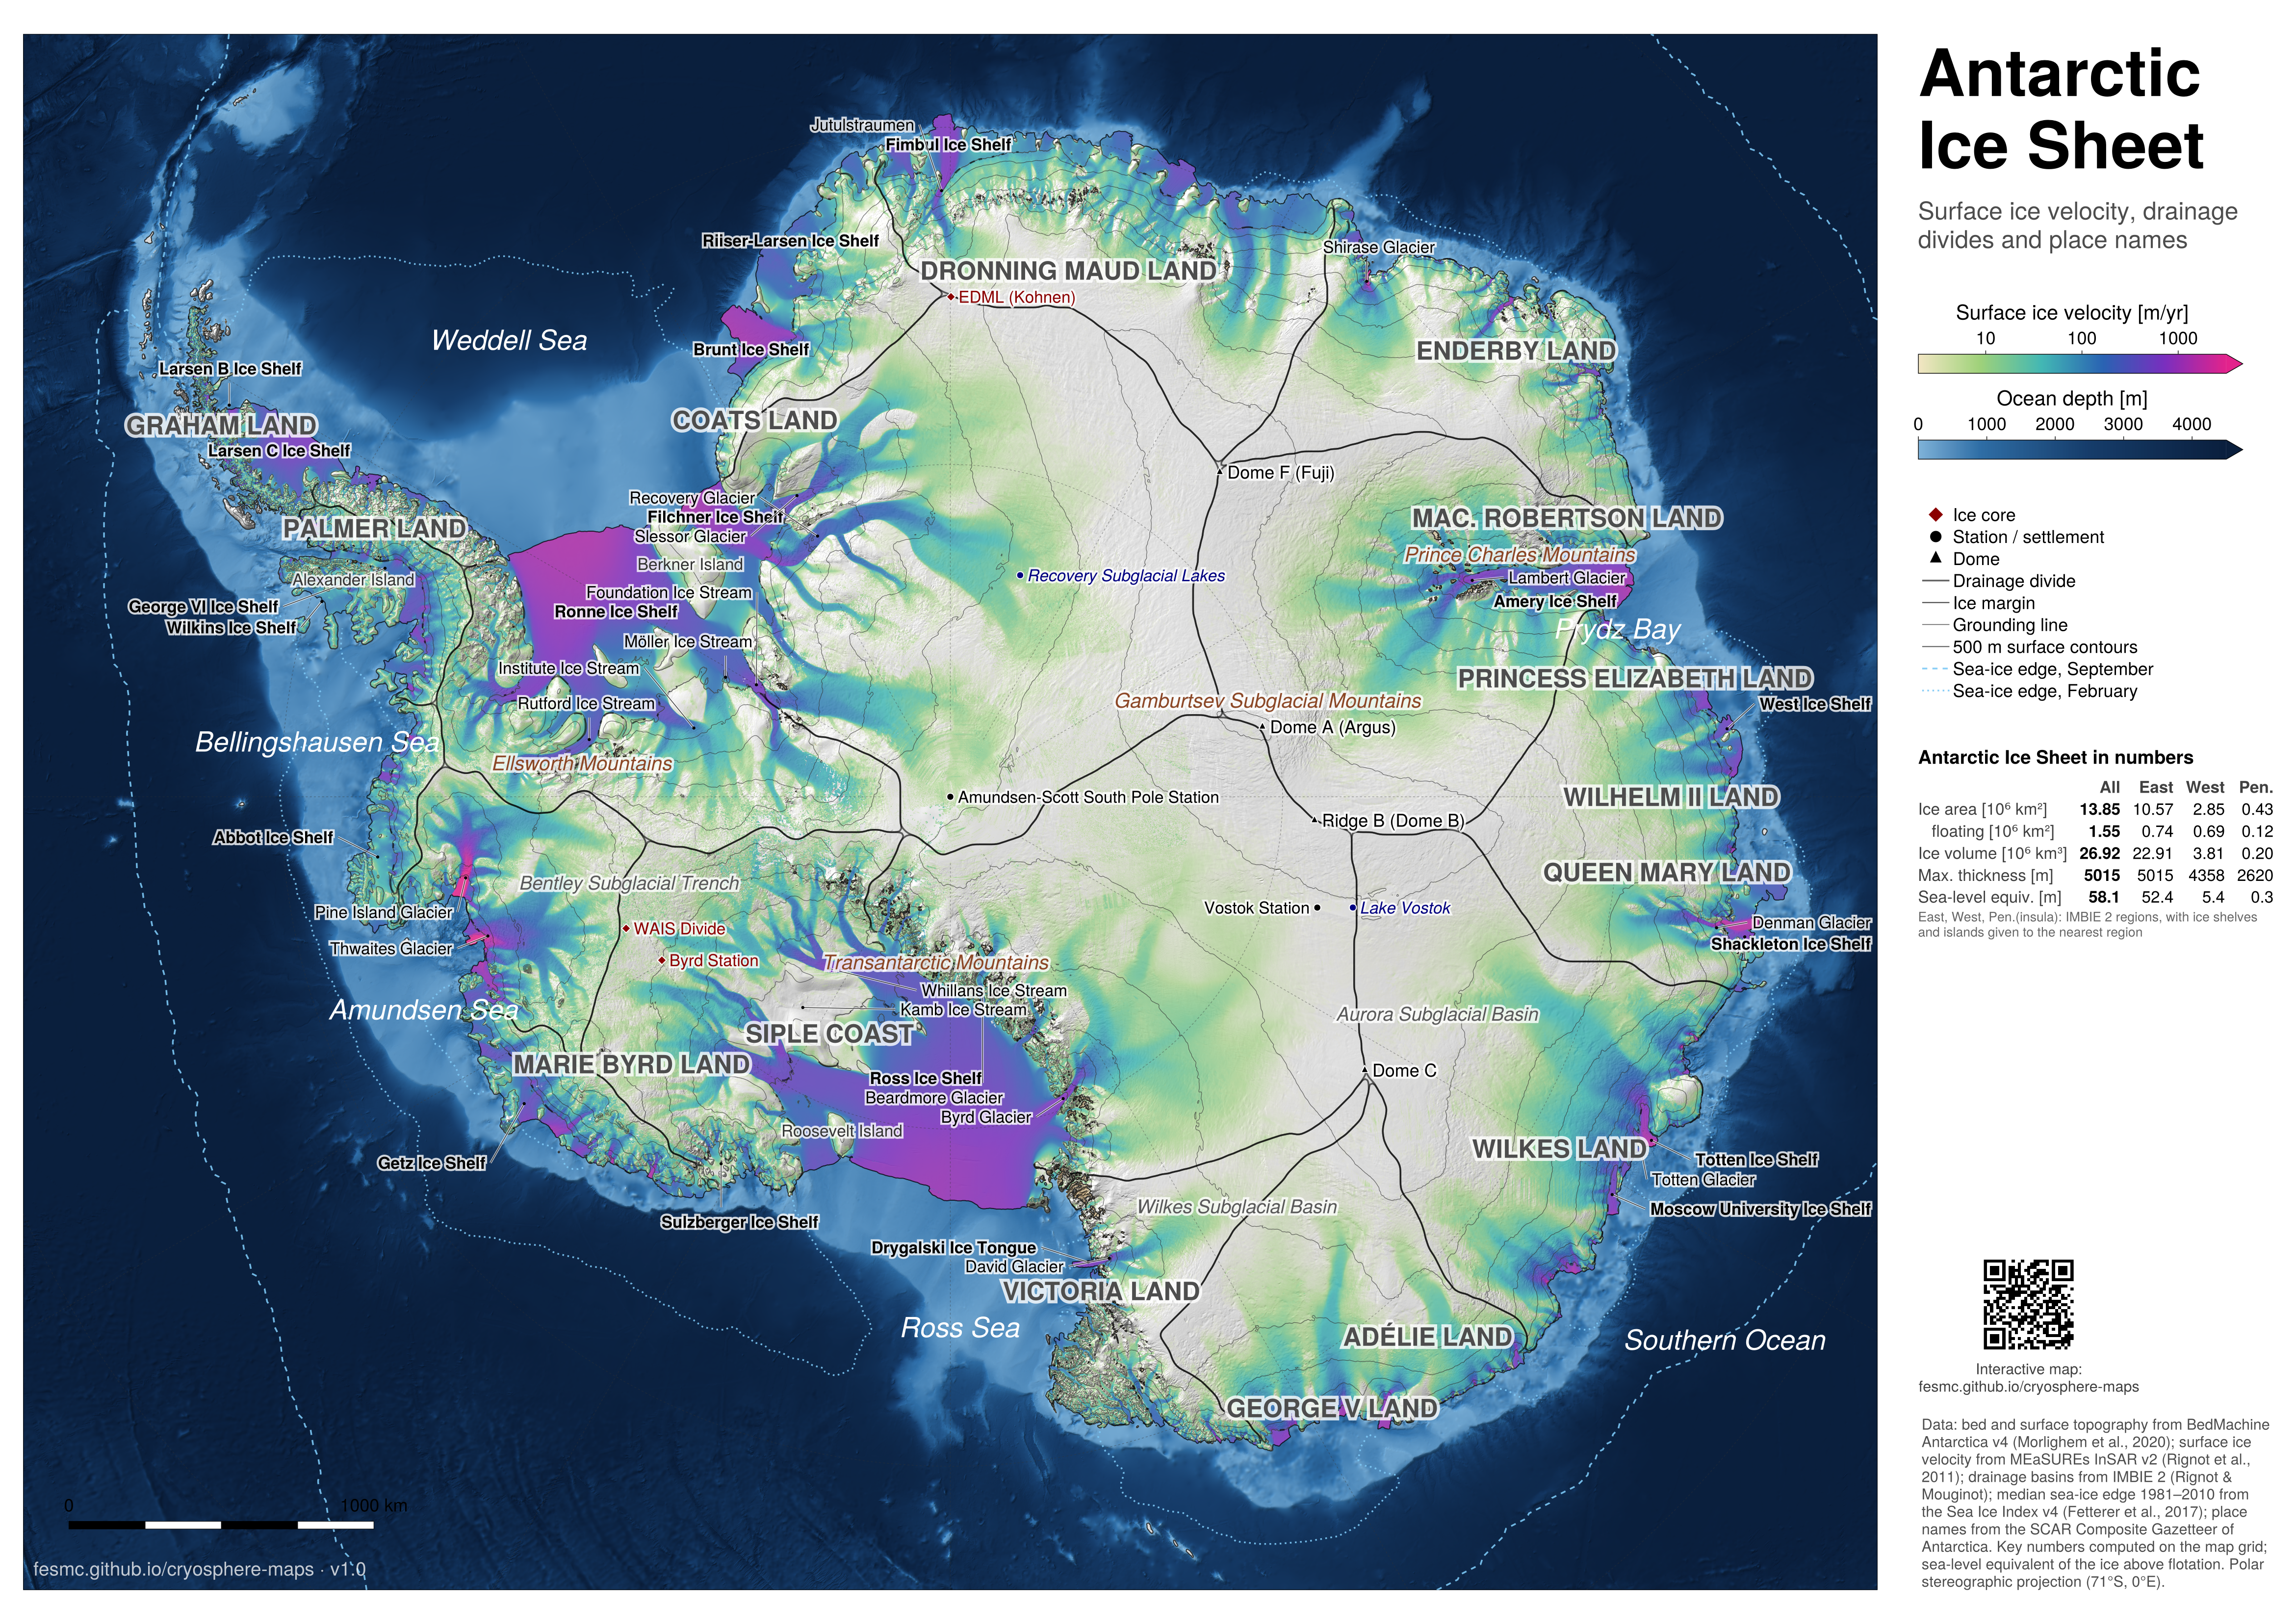
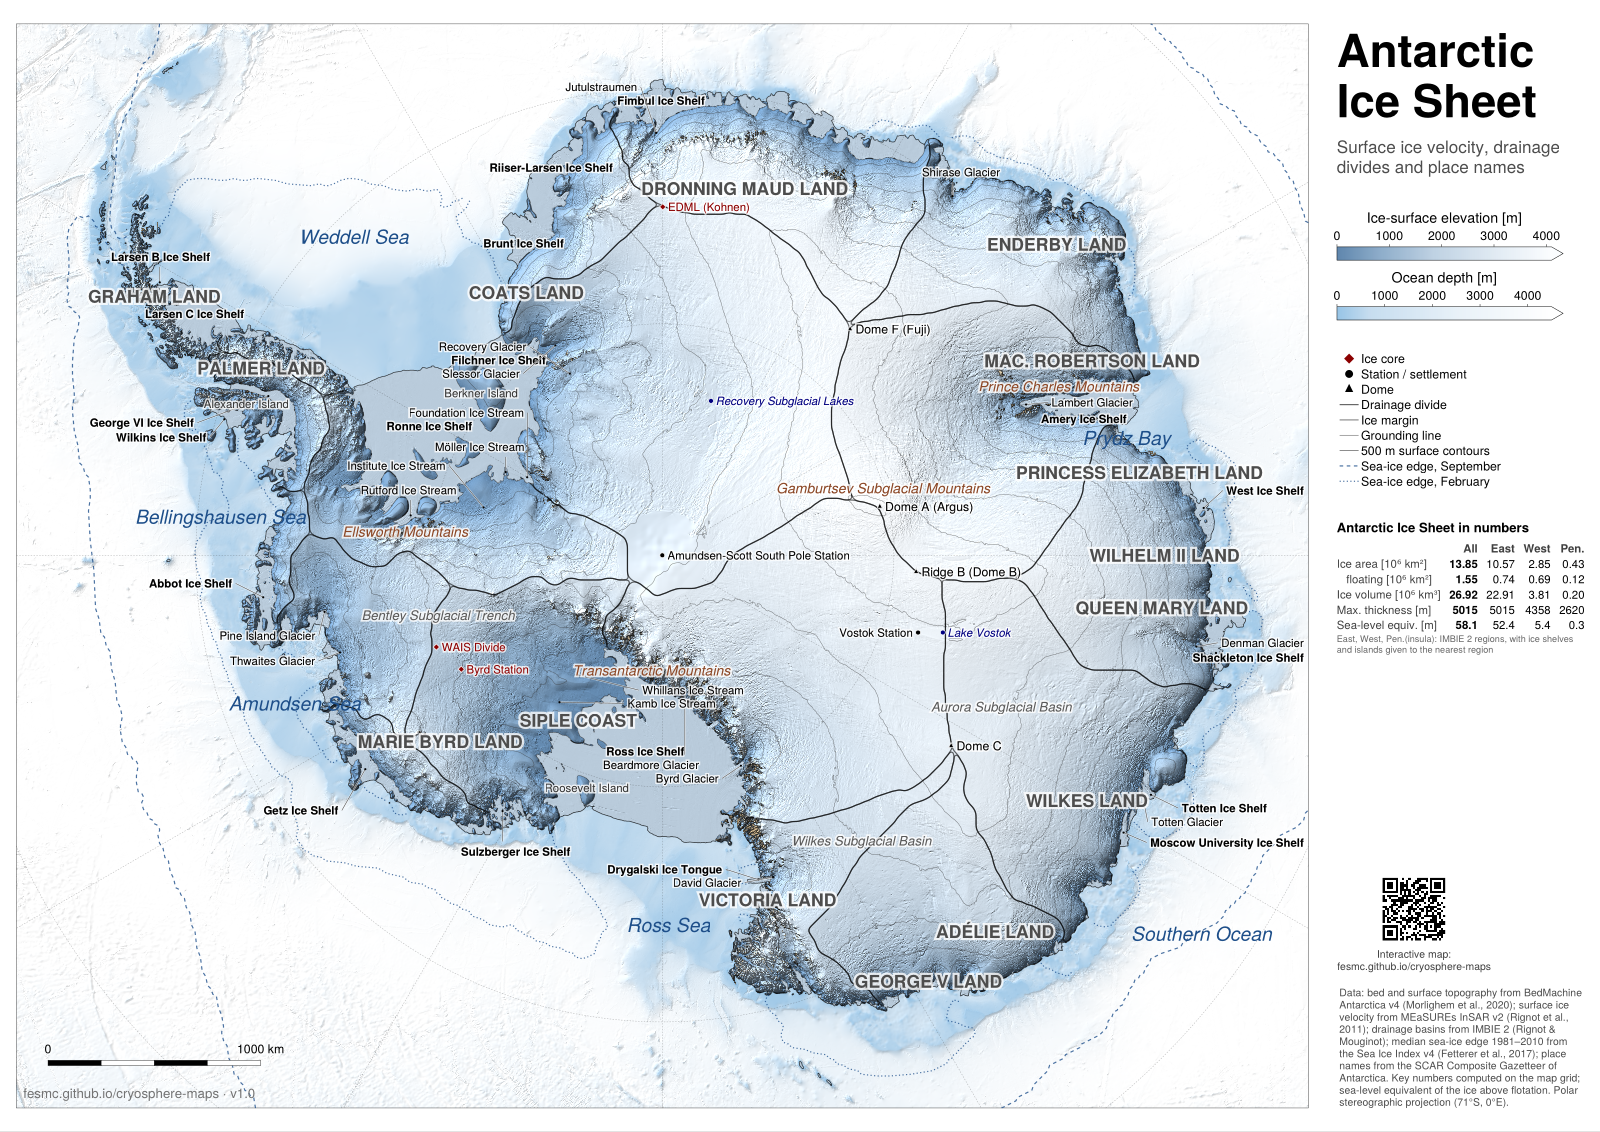
Antarctica: surface elevation · PDF, A0, 42 MB · PNG, 100 dpi, 18 MB
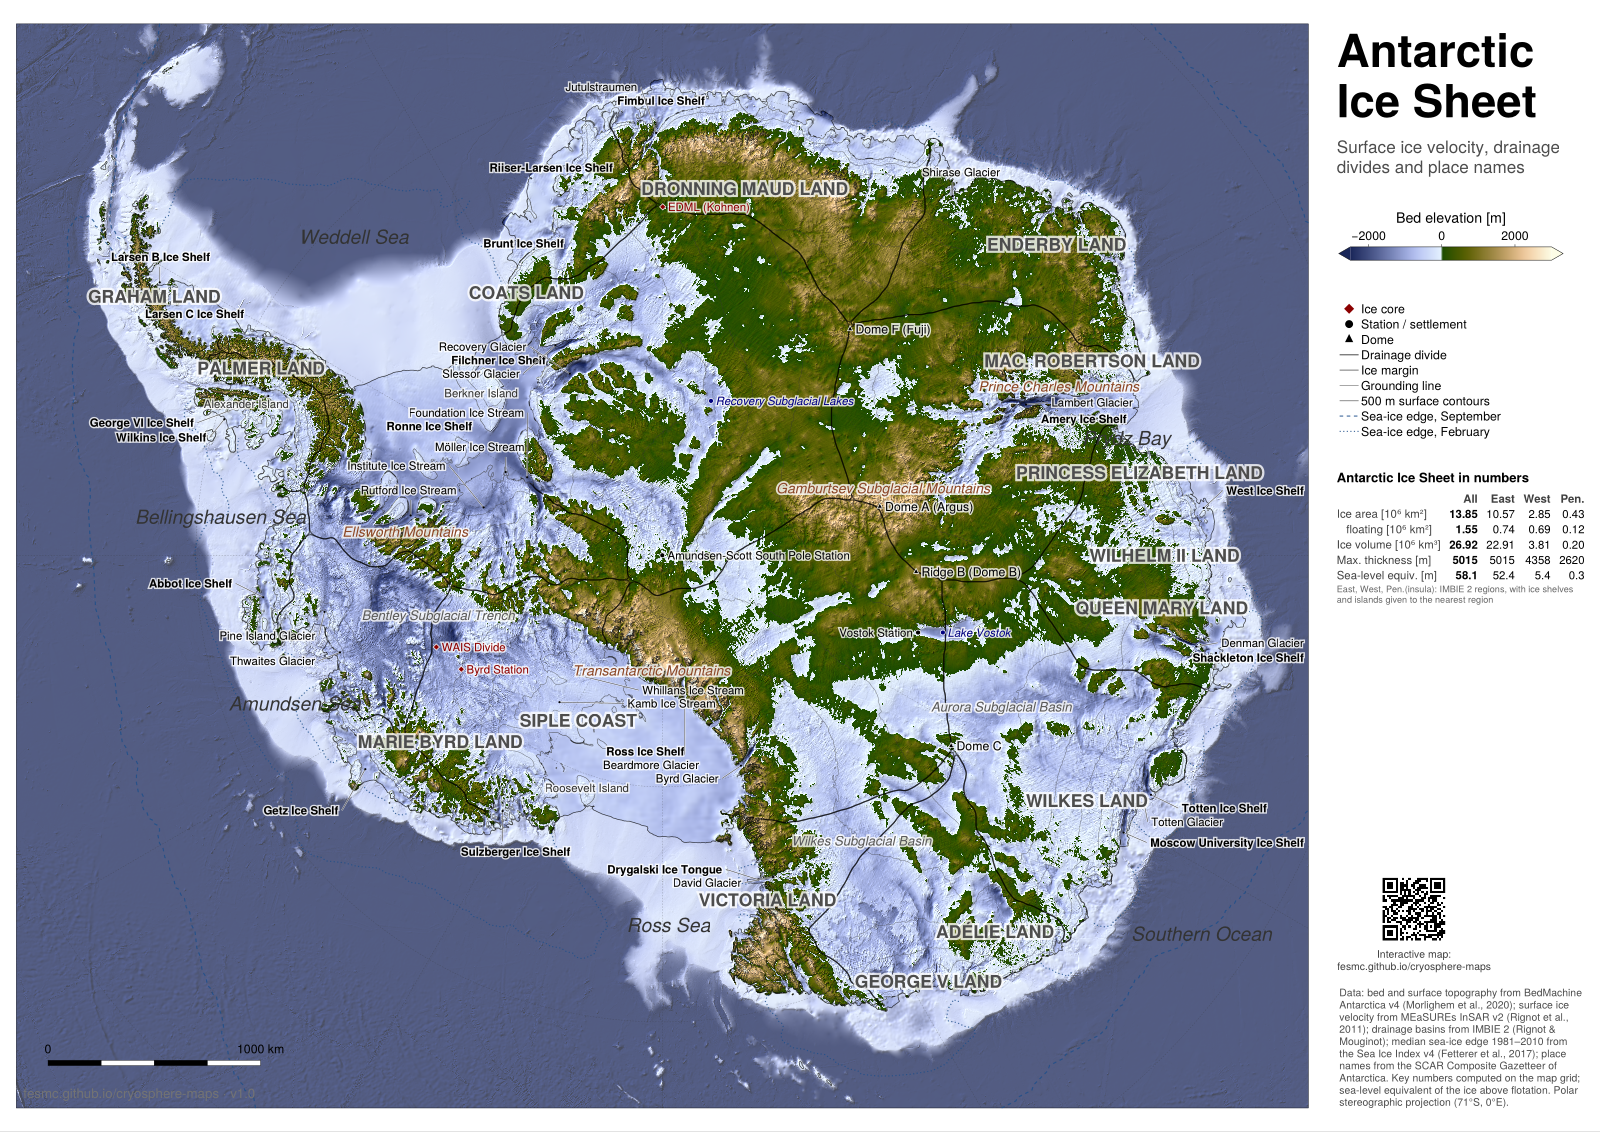
Antarctica: bed topography · PDF, A0, 47 MB · PNG, 100 dpi, 18 MB
Key numbers compared with published estimates
The key numbers on the posters are computed from BedMachine on the poster grids (see Data & methods). They agree with published estimates within the spread between datasets.
Greenland (BedMachine v6, 500 m grid)
| Poster | Published | |
|---|---|---|
| Ice volume | 2.98 × 10⁶ km³ | 2.99 ± 0.02 × 10⁶ km³ (BedMachine v31) |
| Sea-level equivalent | 7.4 m | 7.42 ± 0.05 m (BedMachine v32) |
| Ice area | 1.73 × 10⁶ km² | ~1.7 × 10⁶ km² (depends on what counts as peripheral ice) |
| Maximum thickness | 3411 m | ~3.4 km |
Antarctica (BedMachine v4, 1 km grid), compared with Table 5 of Bedmap33
| Poster | Bedmap2 | BedMachine v3 | Bedmap3 | |
|---|---|---|---|---|
| Area incl. ice shelves (10⁶ km²) | 13.85 | 13.92 | 13.59 | 13.63 |
| Grounded area (10⁶ km²) | 12.30 | 12.30 | 12.35 | 12.10 |
| Volume incl. ice shelves (10⁶ km³) | 26.92 | 26.92 | 26.77 | 27.17 |
| Sea-level equivalent (m) | 58.1 | 58 | 58 | 58 |
| Maximum thickness (m) | 5015 | 4897 | 4822 | 4757 |
- The regional sea-level equivalents (East 52.4 m, West 5.4 m, Peninsula 0.35 m) add up to the total and agree with the 52 m (East) and 5 m (West) of Bedmap14.
- The ice-shelf area (1.55 × 10⁶ km²) is close to Bedmap2 (1.62) and Bedmap3 (1.53).
- The maximum thickness is the least robust number: it depends on the bed product. On the poster it lies in the Denman Glacier trough (67.5°S, 99.3°E), the deepest bed in BedMachine; Bedmap3 puts its thickest ice at 76°S, 118°E.
- BedMachine thicknesses are ice-equivalent (firn air removed), so volume and sea-level equivalent need no firn correction.
About
The maps and website were designed by Alexander Robinson (alexander.robinson@awi.de) with help from Anthropic Claude Code.
Footnotes
Morlighem et al. (2017), BedMachine v3, Geophys. Res. Lett. 44, doi:10.1002/2017GL074954.↩︎
Morlighem et al. (2017), BedMachine v3, Geophys. Res. Lett. 44, doi:10.1002/2017GL074954.↩︎
Pritchard et al. (2025), Bedmap3, Scientific Data 12, 414, doi:10.1038/s41597-025-04672-y.↩︎
Lythe et al. (2001), BEDMAP, J. Geophys. Res. 106, 11335–11351, doi:10.1029/2000JB900449.↩︎