Ice sheets at the Last Glacial Maximum
Maps of the Northern Hemisphere ice sheets and of Antarctica 20 000 years ago, at the Last Glacial Maximum, in the styles of the present-day posters: the ice-surface elevation and the bed topography, with the present-day coastline and ice margin for comparison. The ice sheets come from the PaleoMIST 1.0 reconstruction (Gowan et al., 20211). Its changes since then in ice, surface and bed (including the lower sea level) are added to present-day topography (ETOPO 2022 and BedMachine Antarctica v4), see Data & methods.
Maps
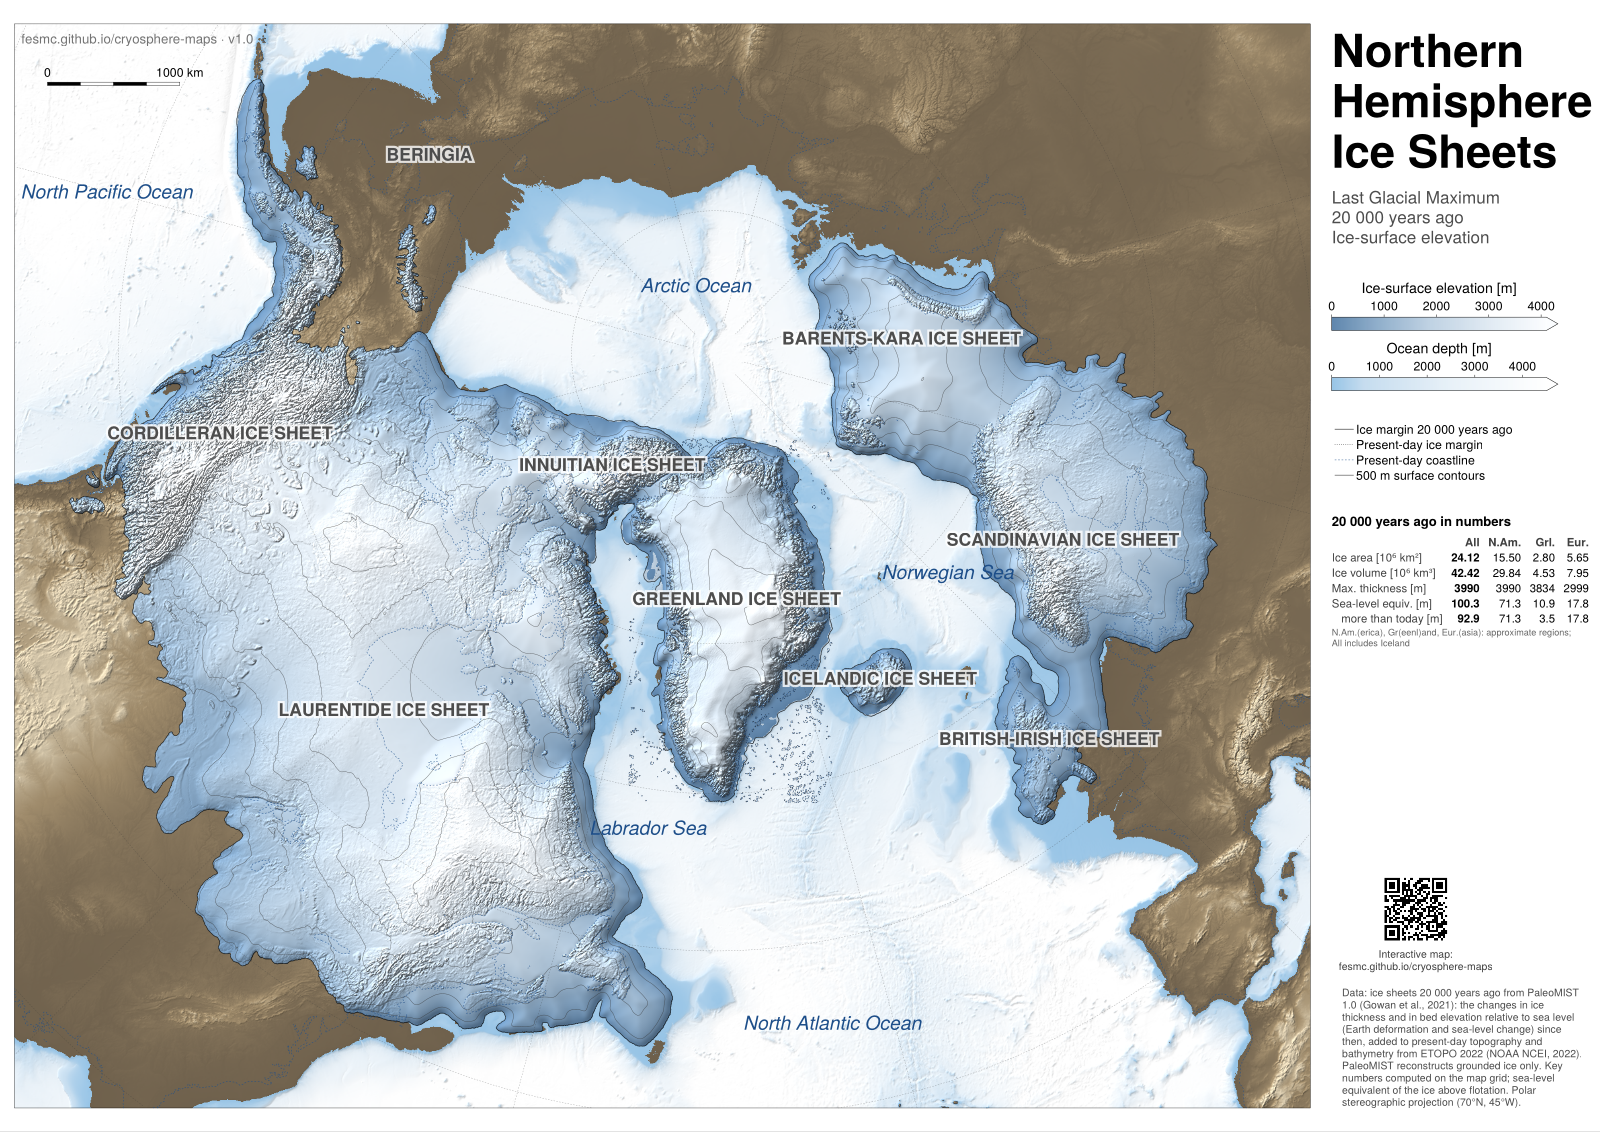
Northern Hemisphere, 20 ka: surface elevation · PNG, 1600 px, 3 MB
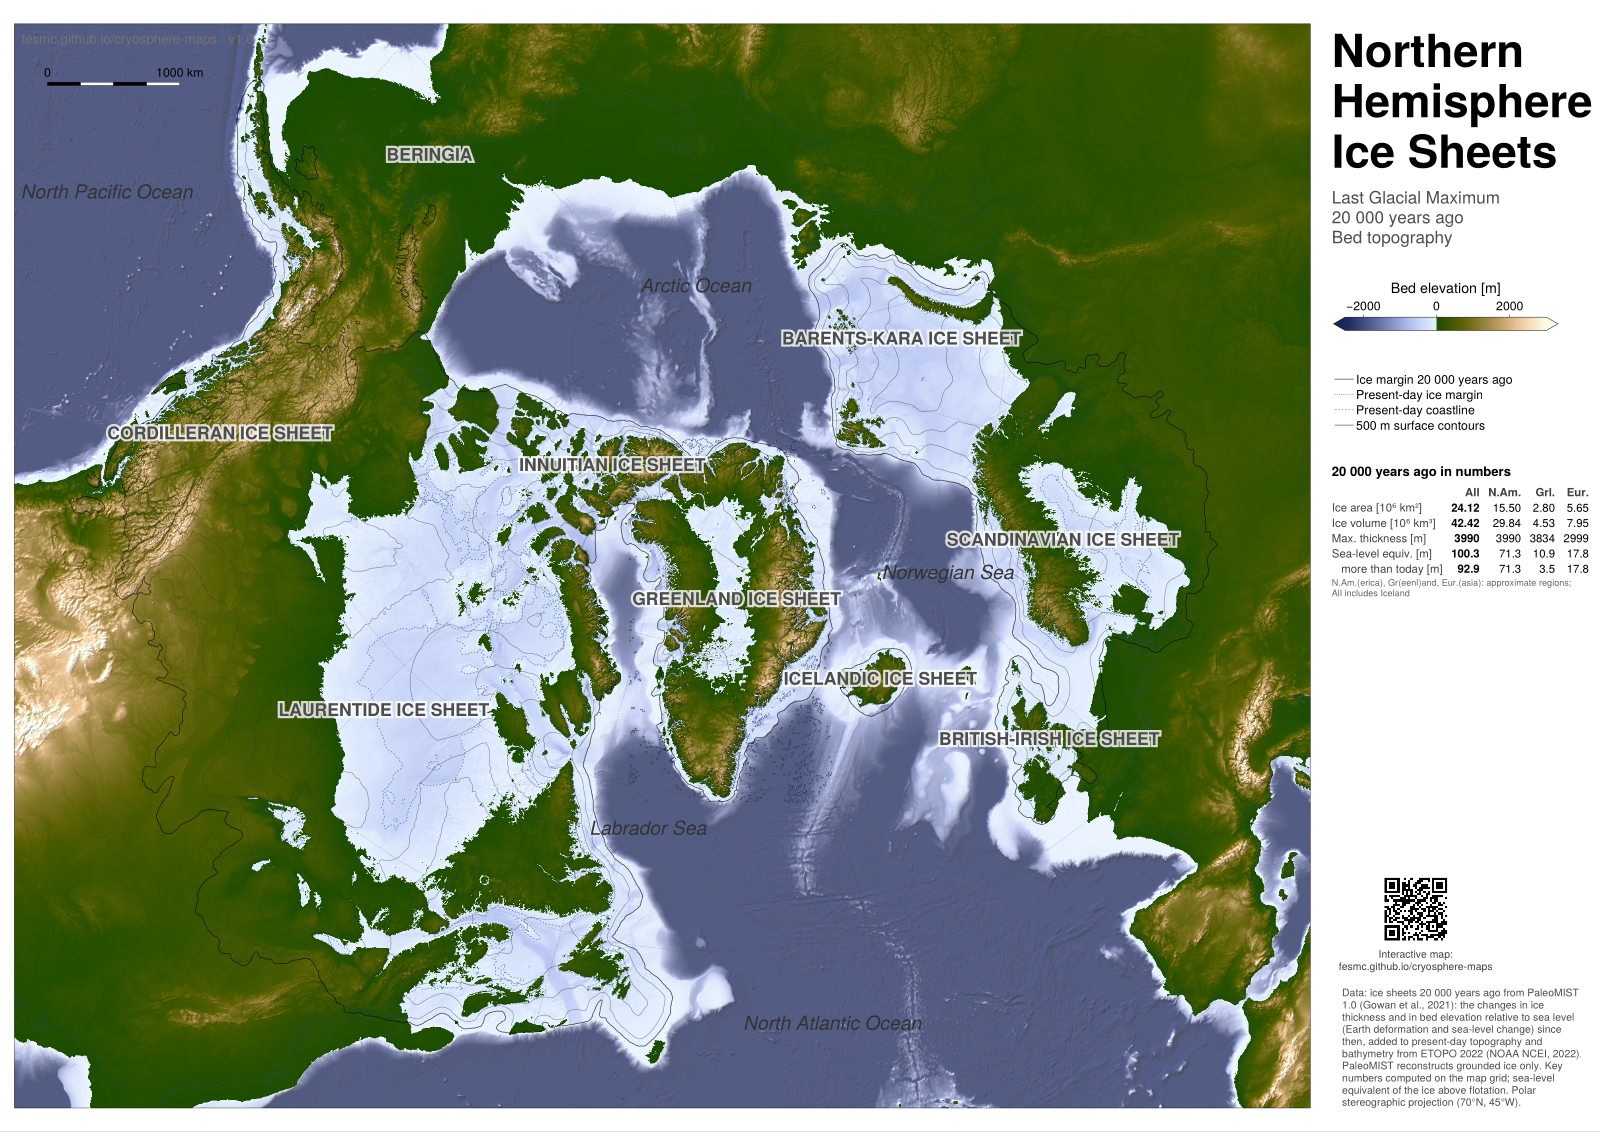
Northern Hemisphere, 20 ka: bed topography · PNG, 1600 px, 2 MB
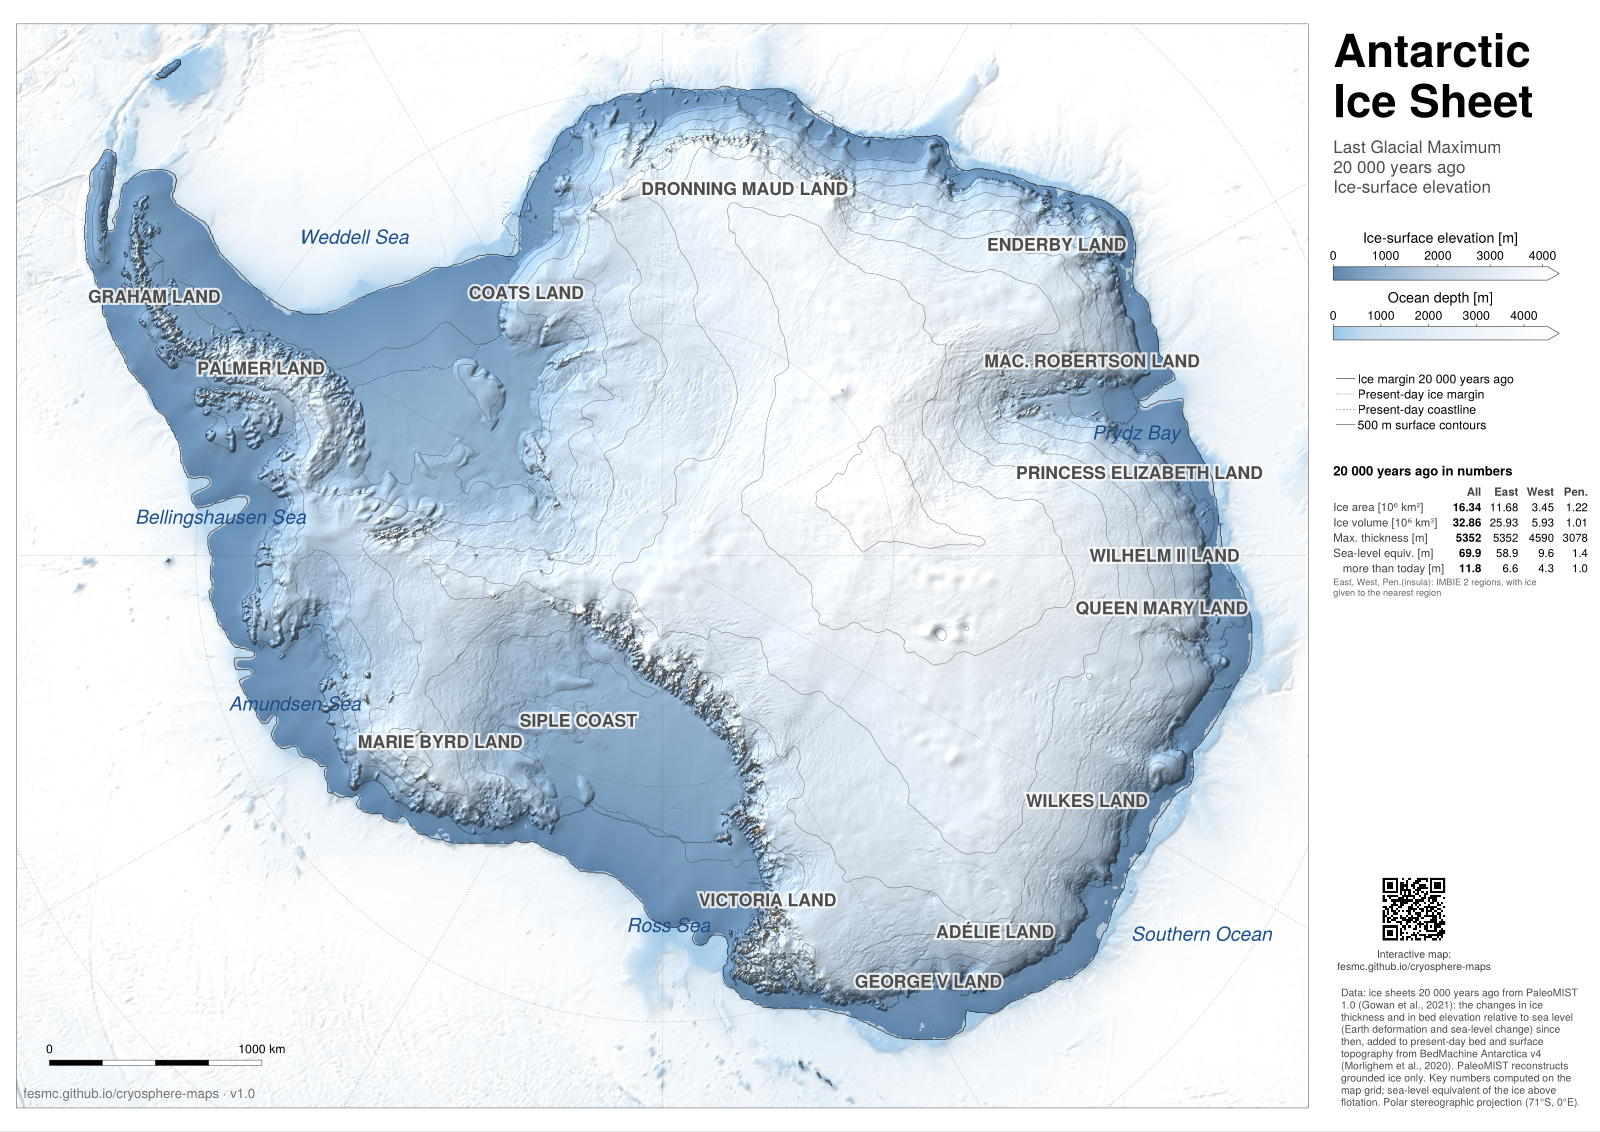
Antarctica, 20 ka: surface elevation · PNG, 1600 px, 2 MB
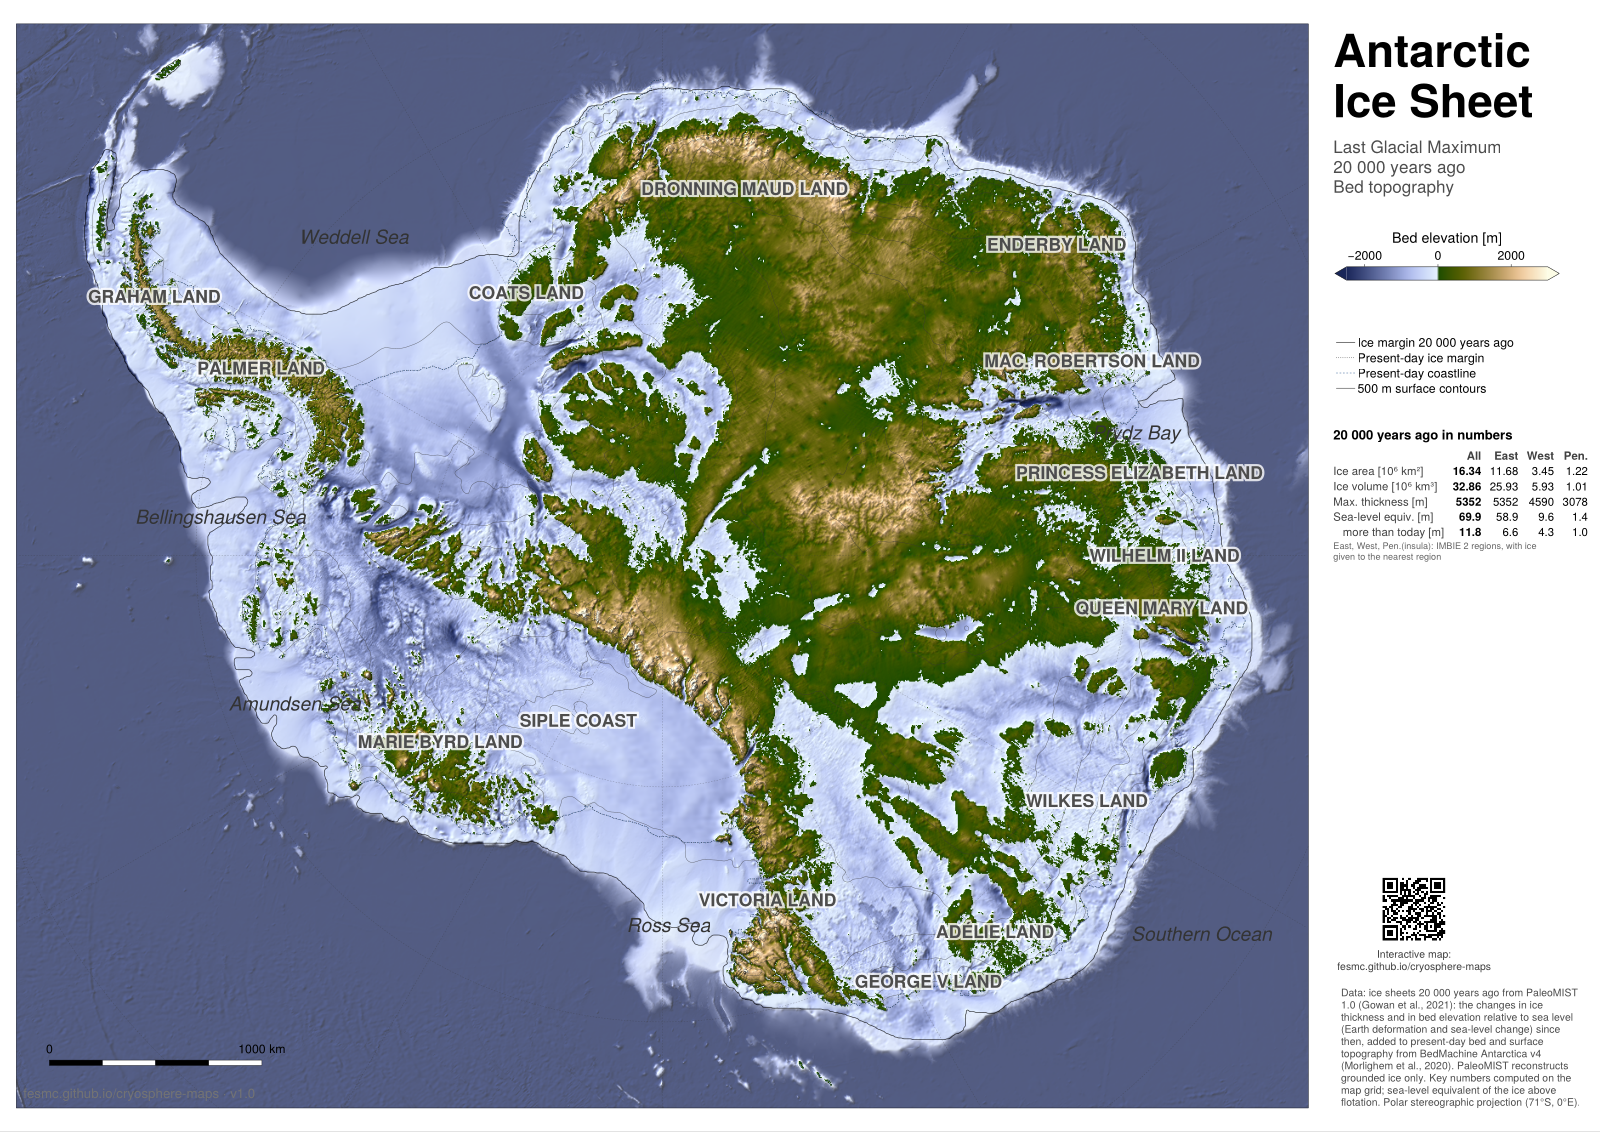
Antarctica, 20 ka: bed topography · PNG, 1600 px, 3 MB
Key numbers compared with published estimates
Ice volume and sea-level equivalent more than today, per ice sheet, computed on the map grids, compared with the values of PaleoMIST at 20 000 years ago (volume_sorted.txt of the data set).
| Map: volume (10⁶ km³) | Map: sea-level equiv. (m) | PaleoMIST: volume (10⁶ km³) | PaleoMIST: sea-level equiv. (m) | |
|---|---|---|---|---|
| North America, Greenland, Iceland | 31.5 | 75.0 | 30.7 | 77.3 |
| Eurasia | 7.9 | 17.8 | 7.3 | 18.5 |
| Antarctica | 5.9 | 11.8 | 3.9 | 9.7 |
| Patagonia | — | — | 0.3 | 0.7 |
| Total | 45.4 | 104.7 | 42.2 | 106.3 |
- The sea-level equivalents of the maps count the ice above flotation, as on the present-day posters; those of PaleoMIST are its ice volume over an ocean of 3.61 × 10⁸ km² (ice density 910 kg m⁻³).
- The Northern Hemisphere numbers agree with PaleoMIST within a few percent. For Antarctica, the PaleoMIST thickness grids themselves give 6.4 × 10⁶ km³ more ice than today on the map grid, close to the map; the smaller volume in
volume_sorted.txtis not explained by the method of the maps. - PaleoMIST has less ice than earlier reconstructions: 42.2 × 10⁶ km³ and a maximum sea-level fall of 116 m (Gowan et al., 2021), against 53 × 10⁶ km³ and 130–135 m from far-field sea-level data (Lambeck et al., 20142).
Footnotes
Gowan et al. (2021), A new global ice sheet reconstruction for the past 80 000 years, Nature Communications 12, 1199, doi:10.1038/s41467-021-21469-w; data: doi:10.1594/PANGAEA.905800.↩︎
Lambeck et al. (2014), Sea level and global ice volumes from the Last Glacial Maximum to the Holocene, PNAS 111, 15296–15303, doi:10.1073/pnas.1411762111.↩︎